I am with bigblue BULLISH! But we will see some big resistence after a short while and that resistence could take a lo...ong time to break. Maybe if the political stuff will not favorable we will see another bottom after that but only God knows that, maybe Saddam knows too 😀
You are using an out of date browser. It may not display this or other websites correctly.
You should upgrade or use an alternative browser.
You should upgrade or use an alternative browser.
madasafish
Well-known member
- Messages
- 470
- Likes
- 5
to me the Nikkei looks due for a rally and I'm going to long some IT warrants I think...
Prophet.net goes back to 1915 for the Dow, and inception for all other US stocks and indices.
http://www.prophet.net/analyze/javacharts.jsp
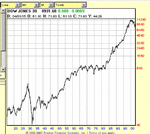
Dow example attached
http://www.prophet.net/analyze/javacharts.jsp
Dow example attached
Attachments
- Messages
- 2,325
- Likes
- 17
On TC2000 I have the data for the S&P500 going back to January 1962 - not sure if S&P existed before then.
The Dow daily charts go back to 1915.
Hang Seng goes back to 1987.
FTSE100 goes back to 1995.
The Dow daily charts go back to 1915.
Hang Seng goes back to 1987.
FTSE100 goes back to 1995.
tradesmart
Experienced member
- Messages
- 1,286
- Likes
- 22
Looking at Roger's 87 year Dow chart, I find it heartening to see that if the bear market continues into the new year there is an obvious support level at around 840 established between 1965 and 1985! (I'm strong on t/a y'know) 😀 😀
TradeSmart
TradeSmart
madasafish
Well-known member
- Messages
- 470
- Likes
- 5
hmm Dow support at 840..
Well if it gets there we will neither need it or be able to trade it.. because the world financial system will have crashed and most banks and institutions will have gone bust🙂 long before then!
Well if it gets there we will neither need it or be able to trade it.. because the world financial system will have crashed and most banks and institutions will have gone bust🙂 long before then!
tradesmart
Experienced member
- Messages
- 1,286
- Likes
- 22
madasafish,
I'm that confident, I'm going to short it and will be looking to cover at 1000 (no stop-loss necessary!)
TradeSmart
I'm that confident, I'm going to short it and will be looking to cover at 1000 (no stop-loss necessary!)
TradeSmart
Tradesmart - you have of course picked on one of the more interesting features of this chart. Also note that after the 1929 crash it took 26 years until 1955 for the Dow to recover to its former high.
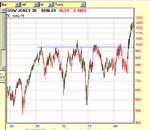
Then when the Dow hit 1000 for the first time in 1966 it took until 1982 for it to break thru the 1000 resistance level.
Then when the Dow hit 1000 for the first time in 1966 it took until 1982 for it to break thru the 1000 resistance level.
Attachments
Similar threads
- Replies
- 59
- Views
- 18K
- Replies
- 0
- Views
- 2K
- Replies
- 0
- Views
- 801


