Originally posted in Traderpedia:
http://www.trade2win.com/boards/traderpedia/54928-position-trading.html
After searching for "Position Trading" I came across the post by thetopbloke, and didn't realise I was in the incorrect section to be posting a method of trading.
However ...
This is one of my fav subjects ... position trading. In fact I am completely baffled as to why traders spend so much time trying to make money scalping.
But that's understandable - I suck at scalping!
On the other hand, it could be because of my belief that no trader should attempt to trade FX unless they have managed to master at least 4H charts. I would recommend Daily charts for beginners - but that's me. Obviously people are doing very well through scalping techniques, going by the proliferation of threads covering that method of trading.
I hope one day to graduate to scalping, but it is a deadly environment for slow-wits like me.
Meanwhile - position trading!
I have a method I like to use that involves lagging indicators, though why we have to call them "lagging indicators" is beyond me - they ALL lag!
Set up MT4 chart as follows:
1) Price bars preferred to candles - own choice
2) 4-Period EMA
3) 10-Period SMA
4) RSI 14-Period
5) Stochastic 14,3,3
6) 2-line MACD (with or without histogram) 8,12,9
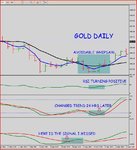
That is the basic template. I prefer no histogram on MACD as I am simply looking for the lines to cross. Remember too that MACD and Stochastic show different things, and for position traders these are helpful to our decision making.
a) MACD warns us that a trend is beginning to gain momentum, or slowing.
b) Stochastic warns us that a trend is beginning or ending.
The other thing I use Stochastic for, is to tell me the STRENGTH of a trend. You may not agree with me, but for as long as the Stochastic remains above 80 in the "over-bought" zone, the rally will continue hard, and vice versa for under 20 in "over-sold zone." It's just one of the indicators that allows me at a glance to tell if my trade needs maintenance or not.
If Stochastic is above 80, and I am "long" then I don't need to be concerned for the health of my trade.
RSI is an "optional extra" - it's a personal choice, and to be candid, I rarely consciously use it. It can be used to generate confidence depending on whether RSI is already above its 50 line, or turning up from underneath its 50 line. Both of those conditions will mean different things to different traders. Some will wait until RSI DOES cross its 50 line before going "long." I don't - if it is turning up, and agrees with Stochastic, then I become seriously interested in a trade.
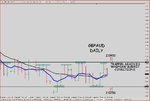
The attached chart is the current action in the NZDUSD.
This is a take-your-time trade - no rush, no errors.
But to trade this way you are far better to use LOWER leverage - less than 50:1 and to use stops based on 1.5 x ATR.
Have a play with the concept - I love it.
Other options are to have an additional 2 templates set up identically except for the MA's.
1) 2-Period EMA with 5-Period SMA
2) 6-Period EMA with 15-Period SMA
The fine tuning advantage these additional templates give, is a faster and slower cross respectively of the MA's, or a view of the relative positions of the two MA's. This is the same as looking at different time frames when trading with other styles.
Last comments:
Yes - the relationships hold true for other TF - eg 4Hour and 1Hour.
And no - I don't have the perfect exit for you. These are discretionary according to risk profile. If you are cautionary, you will exit on loss of momentum as shown by MACD, or on potential reversal as shown by Stochastic.
My personal choice is to exit when the two MA's cross again, but not always ... sorry I couldn't be clearer about exit.
As I mentioned - I suck at scalping, so can not confirm their usefulness in that genre.
Good luck with it - shouldn't be need for too much comment, unless you wish to post your own nice trades.
Kind Regards
Ingot


