Rolston
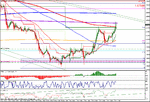
Can you show a gbp/usd chart demonstrating the run down to 4hr support and your buy area at 5564, also your blue / red ma's what are these set at, can you explain a little more the logistics on the gbp/usd chart? How/where does it tell you for support/rest levels or do you work these out separately, when I try to work them out I start from the daily with close correllation to the ATR ranges.
Can you show a gbp/usd chart demonstrating the run down to 4hr support and your buy area at 5564, also your blue / red ma's what are these set at, can you explain a little more the logistics on the gbp/usd chart? How/where does it tell you for support/rest levels or do you work these out separately, when I try to work them out I start from the daily with close correllation to the ATR ranges.

