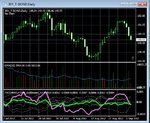
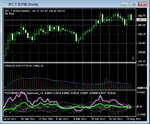
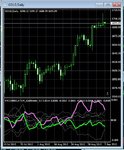
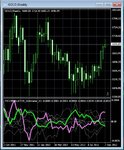
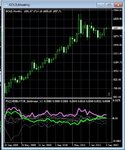
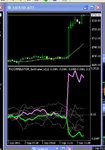
Here are a daily and weekly charts for 30Y T-Bonds in case anyone has them (can also be traded on the stock market via the ETFs long=TLT, 2x short=TBT)
The violet line representing the Bonds is crossing both the USD line and the 0 level in the 2 charts, this looks to me to be a very long term down signal.
At the same time, in the daily chart we see that volume is growing (green bars) together with the falling candlesticks of the price, especially during the last few days, which also implies that there is conviction in the down trend.
Personally, I have bought the TBT ETF and it's also possible to buy a put option on TLT (with expiration at least in January '13, or even longer term ones with expirations in 2013 or 2014), or if your forex broker has it - just short it with proper money management - i.e. sell just a little and wait for weeks and months at least. In any case it's very important not to bet the house on it because there may be upswings with drawdowns so you'll sleep better at night and also nothing is 100% guaranteed.
Noam

