You are using an out of date browser. It may not display this or other websites correctly.
You should upgrade or use an alternative browser.
You should upgrade or use an alternative browser.
Hooya, Just had a closer look at the chart.... Gap fill 3/6-4/6 right ?KJH said:Hi Hooya,
I can see where you get the, ' low 20's...' from ( I think ! ) but I'm missing something on the "35 is the key..."
Would you mind elaborating ?
Thanks,
KJH
KJH
that gap was filled on a dip to 28 soon after open I believe(but might be wrong). My thoughs were that there is some support there plus i had it as a pivot point and my indicators are oversold intraday but whatever the case we are back in congestion area between 4400 and 4470 so expect a few nice swings.
Sorry for slow reply I was out and about
Sorry for slow reply I was out and about
Thanks for the repy and taking the time and effort to do so.Hooya said:that gap was filled on a dip to 28 soon after open I believe(but might be wrong). My thoughs were that there is some support there plus i had it as a pivot point and my indicators are oversold intraday but whatever the case we are back in congestion area between 4400 and 4470 so expect a few nice swings.
Sorry for slow reply I was out and about
Regards,
Kjh
no as a gap close would have ot be to 84...it was based on ma's, fib retracement..support/resistance. This morning is looing very corrective so far....it couldnt even get over the pivot.So watching closely. Think I would exit at 63 if I got it but as I said its looking a bit weak at the mo
Hi,
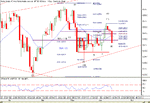
I've been posting a daily chart on Mondays reviewing the past week, but missed yesterday....so we have it here with yesterdays move.
Some thoughts for your comments / suggestions etc all EOD speak...
The market moved up off June 3 low and braking out of the sideways consolidation with a 3 day move up. Stopping just above a 61.8% Ret of the range from Apr23 high to May 17 low.
This has been followed by 4 days down with yesterday looking as tho it exhausted the move down (for the time being ?? )
So we have 3 days up and 4 down and didn't take out the low--June 3.
Where too from here? I don't know (!) but we do have fib resistance at 4462=38.2% Ret, previous swing highs at 4471-72, also the 50% Ret of this down range.
We may just camp around 4446 again which is 50% level of the last range (Mar 24 low to Apr 23 high) tho I somehow doubt it.
If the US gets moving to the down side they have already put in a series of lower lows and lower highs and are potentially vulnerable.
Personally I'm expecting a break to test the recent old highs before more sideways consolidation and ultimately a 30 -38% Retrace of the whole rally up from the Mar 03 Lows--but that is another discussion.
On the downside for the FTSE we have have support at 4395-4400
Cheers
kjh
Attachments
corrective = slow, non impulsive...corrective to the down move...i.e not a new move that will send us to new highs.
pivot....well you know what a pivot is. The pivot is quite a strong intraday r/s level so if it cant break that (which it has now though) I would expect it to continue in the recent trend direction i.e down.
pivot....well you know what a pivot is. The pivot is quite a strong intraday r/s level so if it cant break that (which it has now though) I would expect it to continue in the recent trend direction i.e down.
Similar threads
- Replies
- 1
- Views
- 1K
- Replies
- 1
- Views
- 1K
- Replies
- 2
- Views
- 2K


