FTSE100 July 2004

Good question Bracke,


Unfortunately no straight answer on that one. It varies depending on wot sort of bottom it is and where in the overall move the bottom/top lies. Lots of factors come into play like underlying strength, volume dynamics, sentiment, MMs intentions etc. Generally, the closer the retest, the better the bounce.
 
Finirama said:
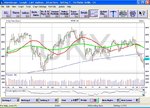
Can somebody who has sharescope do me a favour and post a OHL chart of the FTSE with volumes??


Hi Fin, is this what u wanted?
 

Attachments

  • S'scope.jpg
    S'scope.jpg
    137.8 KB · Views: 159
Finirama said:
Good question Bracke,


Unfortunately no straight answer on that one. It varies depending on wot sort of bottom it is and where in the overall move the bottom/top lies. Lots of factors come into play like underlying strength, volume dynamics, sentiment, MMs intentions etc. Generally, the closer the retest, the better the bounce.

Those drated factors again, so its in the lap of the gods.

Regards

bracke
 
Hi Alliance,

Thank You very much. Just a quick question and pls do not take this the wrong way, but what are you doing with all those moving averages and what purpose do they serve you? If you keep, wot i assume is the 100EMA and use simply use RSI divergence things will be easier to follow and give good results...pls let me cause i am interested.

Bracke,

One othe important factor is time. U will tend to find that if an index bottom/top is not broken within 5 days after a swing high/low, it more often than not signifies a change in direction.
 
bracke said:


How low does the ftse have to go before it is considered a retest ?
Bracke:

Ftse is in danger of completing a week below the 200 day moving average but with oil on the up again, BP and Shell could tip the balance! Looks like the next retest could perhaps be of the April support ....circa 4320 (imho)
 
Finirama said:
Can somebody who has sharescope do me a favour and post a OHL chart of the FTSE with volumes??

Volume not available on RT indices in Sharescope - Just historical.

If its historical you're after, for what period?
 
Hi Pete,

Hoep you are well.

Thank you for theoffer but its cool...alliance has already provided it. Wot are yor thoughts on 320 being the bottom, possible retest and signal for going long
 
Finirama said:
Thank You very much. Just a quick question and pls do not take this the wrong way, but what are you doing with all those moving averages and what purpose do they serve you? If you keep, wot i assume is the 100EMA and use simply use RSI divergence things will be easier to follow and give good results...pls let me cause i am interested.


Hi Fin,
I hate to disappoint u, but as a relative newbie to this type of trading...the answer is...I dunno!.. :rolleyes: I rarely use s'scope, but originally had it set up like that mainly to look @ individual stocks.....20,50,200 sma + trendline. I dont usually have OHLC view either..just straight graph. That's about as much as I understand of it :confused: I see RSI divergence there but am clueless as to what it is exactly. :?:
 
Finirama [QUOTE said:
Wot are yor thoughts on 320 being the bottom, possible retest and signal for going long


Fin:
FWIW, If it gets as low as 320 and falters...then 290's might be likely scenario. If US isnt on the up (post opening), then traders weekenditis could set in ;) Guess @ 320 it could be a half decent risk/reward play tho!
 
Thanks for the honest reply alliance.

Divergence is where where the price and indicator of use and not displaying the same thing.

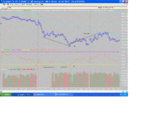
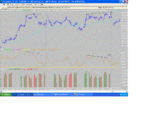
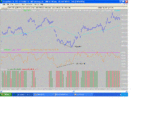
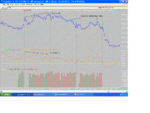
Here are some examples of RSi divergence to clarify.

The first chart is 2 peak positive peak divergence. This is where the price shows a 2nd peak lower high, whereas RSI shows a higher low....this normally signifies a pullback...which u will notice is back to the 100ema on the 10 min chart.

The second chart is 2 peak negative divergence. This is where the price shows a higher higher, whereas RSI shows a lower high, again signifying a pullback.

The third chart is 3 peak postive divergence. Same as the 2 peak with one major difference. it normally signifies the end of the move.....i stress here the end of the move and not necessarily a change in trend.

The fourth chart is 3 peak negative divergence....as above.

Hope this helps.

Fin.
 

Attachments

  • 2PK + Div.GIF
    2PK + Div.GIF
    240.8 KB · Views: 217
  • 2PK - Div.GIF
    2PK - Div.GIF
    244.2 KB · Views: 221
  • 3 peak + Div.GIF
    3 peak + Div.GIF
    247.8 KB · Views: 215
  • 3 Peak - Div.GIF
    3 Peak - Div.GIF
    243.9 KB · Views: 182
Finirama said:
Hi Pete,

Hoep you are well.

Thank you for theoffer but its cool...alliance has already provided it. Wot are yor thoughts on 320 being the bottom, possible retest and signal for going long

Hi there Finirama

I guess the March lows of 4290 - 4310 are an acid test. If they hold following a couple of hard encounters (don't think yesterday quite qualifies) then I agree that we'll see a serious interim rise - say 3-4% but I'm not bullish overall. I reckon we've probably already seen the year's high. Maybe its just the analysts I read, but its hard to find a credible bullish case right now.

That's not to say I'll not continue trading both long and short intra-day positions as I see them - Bloody hard work for not a lot though! - And I'm much more comfortable holding a short than a long, even after seven successive declines!
 
Hope this helps
Finirama


Tnx Fin for that great effort on my behalf, but I am afraid u might as well be talking in Swahilli :confused: Actually, I was getting the gist.............right up until ur second sentence........... :cheesy:

I will print ur post off and have a closer study sometime over the weekend.....maybe the penny (no pun intended) will drop!

Appreciate ur time and effort Fin
 
No probs, got fading volume on the up on the 30 mn chart...so struggling to go any higher
 
Away for the next hour and a half so good luck if you put on a position...needs to blow off a little bit of steam if looking to move up. Taken a very very small and very very speculative short at 379 with stop at 385 so see how it goes when i get back. If it goes well...i'll show you why!!!!!

Catch you then

Fin
 
peterpr:

Interesting reading...makes me feel a lil bit more confident bout the Ftse short I took pre US open, coz where it goes Ftse will follow.

Fin:
No luck on ur trade...was a very tight stop tho...may I ask why? I was waiting on 4385 to enter...but took 4384 short ...hope BP/Shell dont screw it up 4 me ;) Flat @ mo, and thinking that if it does run up..it will fall back b4 close.
 
Finirama said:
Back to be stopped out....oh well ...a loss of £6 should do no harm

Presume that was a spread bet?

I'm dead wary of stops on anything other than direct market prices. I suspect that, when the opportunity presents itself, the SB/CFD quote providers are inclined to fire a hefty spike (a point or two anyway) on their own price just to take out stops - it sort of adds a little to their spread - the icing on the cake so-to-speak.

No offence intended to anyone associated with such a provider of course, but bitter experience is (or ought to be) a good teacher - and that has been mine.
 
Reason for the tight stop was because i was away from the charts...i don't play with stops anymore...don't need them and copy petes sentiment exactly....food for the MMs
 
Top