ftsedaystrategy
Junior member
- Messages
- 45
- Likes
- 0
14 March 2013 trades.
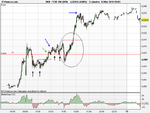
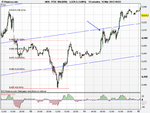
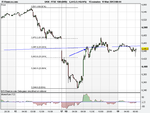
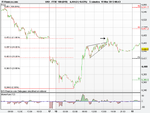
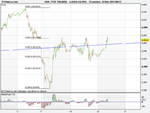
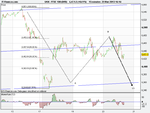
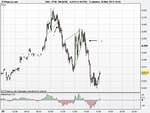
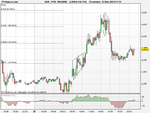
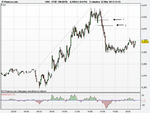
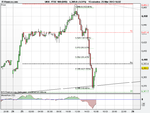
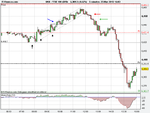
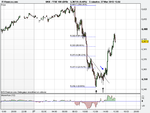
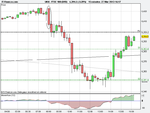
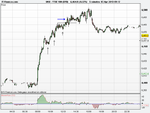
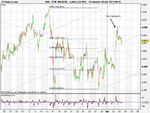
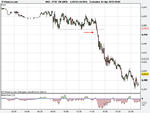
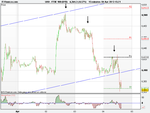
Two very important indicators that I cannot do without are the trend line on the 15 minutes chart coupled with Fibonacci retracements. The reasons why are demonstrated in today’s trading. The market’s opening is close to the trend line as displayed on the 15 min chart. To have an idea whether it is likely to turn or ignore the trend line is where we bring in Mr. Fibonacci. Taking the high of 12 March and low of 13 March we can see that the trend line is near or at the 76% Fibonacci level (blue arrow on the 15 min chart). It’s important to know that most chart packages ignores this number as one of the default Fibonacci numbers, thus it has to be done manually. With two good reasons for resistance, as expected it turns here and between 9am to 11ish am it forms a small double bottom formation. The break above the pattern is close to R1 (green arrow) so I waited to see if it will break above R1 to take a long position with the target being the 76% Fib at 6510 (blue arrow at 6510). All these played out.
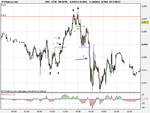
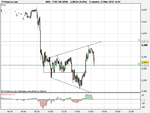
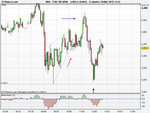
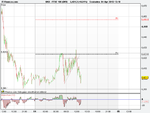
What happened after this is quite interesting. I have circled the interesting bit on the chart. After hitting my target mentioned above, again it forms two small double bottoms and it was struggling to break above as the previous two resistance factors mentioned above was holding it back. It breaks below the pattern and subsequently pulls back and closes above it. The concept of chart pattern characteristics is that if a pattern breaks in one direction and subsequently reverses and breakout in the opposite direction, then that move will be a strong one. Well, indeed it moved 16 points rapidly to my next target at 6534 which was derived from extrapolating using the Fibonacci tool and also aptly the high of 12 March. Bingo!

