Dentalfloss
Legendary member
- Messages
- 63,404
- Likes
- 3,726
stopped out at 1ok..decent pointsa decent move off chronics 10020 area
stop tightened
test 10020..wont leave it alone...thanks chronic
stopped out at 1ok..decent pointsa decent move off chronics 10020 area
stop tightened

Dax since February...till now - longer term view.
Again, I'm still learning Elliot Wave theory - only really properly starter this weekend 😕 so bear with me.
Bigger picture view: Dax is clearly coiling for another move not too sure when but it's clear on the charts. Our move down on Friday was a completion of wave 5 from move from FOMC (see 4 hr chart). Looks like we have an ABC correction now. A has been completed when we got our rally on Friday. And B started towards the close of the US session when we got Dentists sell off. I'd like to see a C move to that area marked in yellow - 10149-10432 area which would give us a completion of wave 4 in a flat correction from wave 3 on the daily (correct if wrong here) for the final move down to 8500 - 8920 area (wave 5). Looks like 2be has that area marked too.

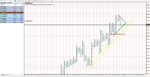
Thought I'd treat you all to a Renko chart. Each 'brick' is 5 points. Trend lines are all bullish with the all important 10,000 level shown in gold . . .
is the plot/close or candle..hilo ?
is the next brick calculated from close or prev high or low ??
can you adjust the plot hilo or close ??
better still...plot against the trend ??
Hi dentist,is the plot/close or candle..hilo ?
is the next brick calculated from close or prev high or low ??
can you adjust the plot hilo or close ??
better still...plot against the trend ??
good stuff..gives a good feel of price action
is that cutepnf ?Downside trgt of 9530 area imo. But I am still learning PnF!

is that cutepnf ?
if so...does it plot the close or just hilo ?
bullseye is better..imhoYes it is, the free version. I was going to buy the latest but there is a bug in it and as far as I can tell it is still there. Been in contact with the writer and he isnt intersted in trading anymore so not too helpful. If I get it sorted I will let you know.
I cant make too many adjustments with it and think its hilo.
bullseye is better..imho
it has Close plot
but you need to export the data
has it got fixed box sizes or log% aswell
log% is invaluable...even intraday ..imhoI agree, just thought i wouldtry and get the hang of PnF before I buy Bullseye.
They used to do a trial period but that has stopped now.
Edit: cute can adjust box size, only whole numbers no log%. Also it is extremely
processor hungary, and this effect how small I can regulate box size.

log% is invaluable...even intraday ..imho