I think its well worthwhile monitoring the position of the Pivots ofother indices as well as what you are trading. Last night I had the DAX, SP and NQ lined up. When one is below a PP and another above, be wary, particularly with the NQ. When they've all gone thro, and maybe one tests a level, then you can get a good run. I had the 3 charts from TradingView adjacent so you can see where they all are...
You are using an out of date browser. It may not display this or other websites correctly.
You should upgrade or use an alternative browser.
You should upgrade or use an alternative browser.
FTSE, DAX, DOW Trading Ideas and discussions
- Thread starter Jessi_trader
- Start date
- Watchers 114
Dentalfloss
Legendary member
- Messages
- 63,404
- Likes
- 3,726
11460 area worked very well this morning
Dentalfloss
Legendary member
- Messages
- 63,404
- Likes
- 3,726
gotcha
Depends on;
- direction trend bias
- short TF indicators like; RSI, MACD, SStochastics and Momentum etc like to see these in OverBought/OverSold OBOS areas 70/30.
- because RSI is around 60 on attached chart I think DAX will still try and take out 11492. When it gets there with RSI around 70 or above then to me that's a sweet spot for a short.
- most trades are intra-day scalps but do hold some for days/weeks
If PP level coincides with an RSI OBOS on short TFs with my trend bias then it's a good probability short
Also use a lot of TSL or limit orders at extended R2/R3 or S2/S3 levels.
Atilla
Legendary member
- Messages
- 21,036
- Likes
- 4,208
11460 area worked very well this morning
Good call Dentist, your level 11460/70 has worked really well today and no breach up.
Looks like we have a flag/wedge forming.
Ripe for breakout. RSI and MACD indicating lack of momentum I'd expect we'll come off the boil from here to 11420s maybe...
Attachments
Dentalfloss
Legendary member
- Messages
- 63,404
- Likes
- 3,726
11460....magnetic
Dentalfloss
Legendary member
- Messages
- 63,404
- Likes
- 3,726
Every little helps
Dentalfloss
Legendary member
- Messages
- 63,404
- Likes
- 3,726
mornin all
Dentalfloss
Legendary member
- Messages
- 63,404
- Likes
- 3,726
latest breakout on dax
2 trends with a consolidation between them

2 trends with a consolidation between them

Dentalfloss
Legendary member
- Messages
- 63,404
- Likes
- 3,726
here are the trends in dax


Dentalfloss
Legendary member
- Messages
- 63,404
- Likes
- 3,726
if you are thinking differently..you had better go back and reexamine your charts
Dentalfloss
Legendary member
- Messages
- 63,404
- Likes
- 3,726
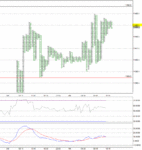
in p/f terms
it is looking overbought

it is looking overbought

Dentalfloss
Legendary member
- Messages
- 63,404
- Likes
- 3,726
11500-11532 area is a biggish horizontal res
chronic ...what is your veiw ??
11564..the big palooka
11460 breakout point
chronic ...what is your veiw ??
11564..the big palooka
11460 breakout point
Dentalfloss
Legendary member
- Messages
- 63,404
- Likes
- 3,726
premarket
a nice move up to test our 11500-11532 area..11520 got hit
move down to 11500
predictable so far
a nice move up to test our 11500-11532 area..11520 got hit
move down to 11500
predictable so far
Dentalfloss
Legendary member
- Messages
- 63,404
- Likes
- 3,726
spx into the open

a recoil in an uptrend
a breakdown to 2084 turns chart slightly more bearish
2082 is a breakout/aqua
if you are thinking differently...then you had better go back and reexamine your charts

a recoil in an uptrend
a breakdown to 2084 turns chart slightly more bearish
2082 is a breakout/aqua
if you are thinking differently...then you had better go back and reexamine your charts
MichaelJohnFX
Senior member
- Messages
- 2,891
- Likes
- 323
MoRning
520 is trend res on 1 hour chart. 420 is trend sup. anything else is no mans land. Can't post charts atm as I'm working away from home this week. Minor Trend res on 30 mins / 15 mins at 494 was broken this morning
520 is trend res on 1 hour chart. 420 is trend sup. anything else is no mans land. Can't post charts atm as I'm working away from home this week. Minor Trend res on 30 mins / 15 mins at 494 was broken this morning
MichaelJohnFX
Senior member
- Messages
- 2,891
- Likes
- 323
GIt a sell signal atm. Too
Dentalfloss
Legendary member
- Messages
- 63,404
- Likes
- 3,726
11494 was a breakout point on 1 minute/premarket
retraced to that and a pump
predictable
11564 res
11532 res
11495/breakourt
11460 prev res..should be supp
retraced to that and a pump
predictable
11564 res
11532 res
11495/breakourt
11460 prev res..should be supp
Similar threads
- Replies
- 4
- Views
- 2K


