You are using an out of date browser. It may not display this or other websites correctly.
You should upgrade or use an alternative browser.
You should upgrade or use an alternative browser.
FTSE, DAX, DOW Trading Ideas and discussions
- Thread starter Jessi_trader
- Start date
- Watchers 114
Atilla
Legendary member
- Messages
- 21,036
- Likes
- 4,208
Hi Atilla,
Hope you don't mind me asking, what is your RSI setting?
Thanks
Hi Greenlight,
Use box standard defaults for both PP and RSI (14,70,30). See chart attached.
Best to wait for OBOS areas above/below 30/70. 20/80s are even better.
However, the MACD/RSI's only used for gauging momentum.
RSI in short TF work best near Pivot Points. Best to wait.
I would only give them 5% significance.
On longer TFs including 15m charts they can bounce along above or below those levels for ages blowing accounts. So beware to close if wrong and just take the loss.
Also, NOTE, they are misleading prior to release of high impact news. So FA and News drive the Technical Charts imo. Don't want to start a big debate but when big news is due out all indicators and chart stuff including price reacts to the news or inside knowledge.
BUT as signals go especially when levels in agreement and line up with PP and Fib retraces the RSI / MACD / Stochastic / Momentum - when they support R/S and falling volumes are usually great confirmations.
I wouldn't rely on them solely. Price, candlestick formation R/S and higher highs and lower lows etc more significant imo.
They do help encouraging one to pull the trigger, entering trade. 👍
Hope that all makes sense... I thought I qualify it as using them in isolation can be costly (I have the T-shirts :cheesy🙂
Atilla
Legendary member
- Messages
- 21,036
- Likes
- 4,208
Dax looks like really struggling with 11300. No momentum for anything.
I think it's just going to limbo into the weekend around PP.
Unless US open lights it up.
USDCAD looks like if the 1:30 news is showing GDP growth for Canada is positive loony should fall based on RSI weakness.
Needs a test of PP @ 1.30s or even PP-S1 @ 1.2950s I reckon... 🙄
I think it's just going to limbo into the weekend around PP.
Unless US open lights it up.
USDCAD looks like if the 1:30 news is showing GDP growth for Canada is positive loony should fall based on RSI weakness.
Needs a test of PP @ 1.30s or even PP-S1 @ 1.2950s I reckon... 🙄
Attachments
Atilla
Legendary member
- Messages
- 21,036
- Likes
- 4,208
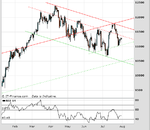
nice channels on dax daily
Yes I see similar narrowing into a channel.
Breakout when it comes should be good.
All eyes on US open...
Dentalfloss
Legendary member
- Messages
- 63,404
- Likes
- 3,726
there we are..we were bullish on spx from this morning
no participation from dax
no participation from dax
MichaelJohnFX
Senior member
- Messages
- 2,891
- Likes
- 323
Dentalfloss
Legendary member
- Messages
- 63,404
- Likes
- 3,726
no rate hike in september
nfp next friday
nfp next friday
no rate hike in september
yep spx up dax down?
Dentalfloss
Legendary member
- Messages
- 63,404
- Likes
- 3,726
ah..but we were long eurusd from the chart posted yesterday afternoonthat employment cost index news USD bearish hence drop in dollar index
1.0900 area was entry
got a nice treat
Dentalfloss
Legendary member
- Messages
- 63,404
- Likes
- 3,726
2103 was trend support
5 min data from 28/07
2106 is breakout point/aqua
last signal is bullish
Dentalfloss
Legendary member
- Messages
- 63,404
- Likes
- 3,726
treats galore today
Dentalfloss
Legendary member
- Messages
- 63,404
- Likes
- 3,726
fxcm getting kicked around big time by holding their usdcad long...lol
Dentalfloss
Legendary member
- Messages
- 63,404
- Likes
- 3,726
back into 2112 and a scalp short as we marked this morning
Atilla
Legendary member
- Messages
- 21,036
- Likes
- 4,208
fxcm getting kicked around big time by holding their usdcad long...lol
That's just another SB company though aren't they? Were they tipping Cad then?
Never pay any attention to anyone else outside of this thread anyhow... 🙂
Dax looks like really struggling with 11300. No momentum for anything.
I think it's just going to limbo into the weekend around PP.
Unless US open lights it up.
USDCAD looks like if the 1:30 news is showing GDP growth for Canada is positive loony should fall based on RSI weakness.
Needs a test of PP @ 1.30s or even PP-S1 @ 1.2950s I reckon... 🙄
absolutely spot on call on the loonie
come off like a train :clap:
Dentalfloss
Legendary member
- Messages
- 63,404
- Likes
- 3,726
dax to pump ??
Similar threads
- Replies
- 4
- Views
- 2K


