Dentalfloss
Legendary member
- Messages
- 63,404
- Likes
- 3,726
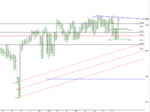
SPY Open Interest and Levels: Taking open interest at face value, it suggests that the market will be rangebound next week, with very little room to move higher, but room to give back some of last weeks gains. Having said that, I would reiterate that just because it has room to move lower it does not necessarily make shorting the best set-up. If the market is truly breaking out, a very tight sideways range may play out. Given the strength in the NDX, the financial sector, and earnings thus far being more positive (and whether deserved or not are being rewarded), my main bias is a mostly sideways market with shallow dips being bought. Having said that I am always open to being wrong and have a plan for different outcomes. Below I have given a brief outline of different scenarios I have a game plan for (more detailed analysis and daily updates are available in my premium service).
Above 213 offers little risk/reward to the upside and there will likely be some give back. If, however the strength continues to new highs in a parabolic fashion and does not give much back take that as a sign that the move could be a trap and a correction is coming. If that is the case though wait for a signal to get short because the move can be large before turning back (and if you like weekly call options, this would be the time to take advantage).
Between 211.50 (gap from Thursday) and 213 suggests healthy consolidation giving the market an upside bias.
Below 211 and there is potential for the gap area from Monday to be tested which aligns with the second highest strike puts near 209.
Below 209 starts to become more bearish as 207 is the next support and suggests the market move up last week was not indeed a breakout in the making.
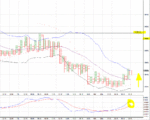
Finally, I want to note that the VIX expires Wednesday morning and there is a decent probability that the VIX moves up early in the week to the 14/15 area. If that should happen and SPY drops to one of the support areas mentioned above it is worth a dip buy as long as their are signs present that the market is not in a free fall (breadth indicators, continued tech and financial strength etc).
To Summarize: As of now my bias is a sideways market with dips being an opportunity to get long. Any further parabolic move above 213 without consolidation would suggest a potential for a short term blow off top in the making. Below 209 and last week may have been a trap.
Good luck next week. If you are looking for much more analysis and guidance to trading the recent volatility (including trading options in high beta momentum stocks)
from Sassy options


