Dentalfloss
Legendary member
- Messages
- 63,404
- Likes
- 3,726
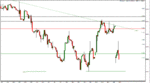
chronics 10970 area worked well
bailed out around break even.......
10970-10998 ae big res areas. Changed chart data and gave me back this. That area has been pre sup / and breakout. 10940 in the past few weeks was more a manipulation down IMO.


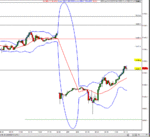
can you see the bounce from the cluster area...prev res now support
then the bounce...latest column of "X"s...
now we are looking for a bad bounce..preferably into res and then not supported
also look to see if the bounce is good and uptrend continues
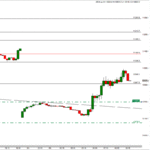
2062 area is res
2070..big res area