FTSE 100 Index Pivot Days

heheh...i see markets as fluid though geo, not solid!

if they were solid it would be easy to fix exact pivots/s&r etc as they would mechanically fit fixed parameters...i don't think that's true.

momentum as a force propels objects, the larger the object and velocity, the longer the time needed for the principle of momentum to diminish once the 'brakes' are put on. this leads to overshooting a 'target', thus a correction is required.

the correction, (the next opening TF bar) would then be a more accurate place to take a calculation, because momentum has been removed from the equation at this point.

that's the way i see it anyway! :LOL:
 
Just a quick thought, and not to discount what you're suggesting DB, because I want to explore your idea, but...

If you throw a ball at the floor, and then it bounces up, where does the end of the down move and the start of up move occur? My answer would be at the same point in both space and time.

Perhaps this is bo**ocks though :whistling

or i suppose another way of putting it is, throw a ball at a wall and it will bounce back.

swing a wrecking ball at a wall and it will break through then come back...so i suppose it a question of, well, how big the ball is! :LOL:
 
I see this subject has gained momentum, with a little divergence :LOL:

Did you watch the GP?
 
i.e. with a powerful movement in one direction (high velocity = more momentum) the price over-shoots what may be the markets true value. only
Overshoots and undershoots are the nature of human response to market information - very true. But digging the 'true value' out at any given time is rather more complex than a simple case of using standard deviations - nor, in my view, is there much point to it.

As a sound engineer, you'll perhaps be wondering if this is a complex waveform can be broken down into its composite simple waveforms perhaps. Or maybe not.

Before consigning ‘the big move’ to the end of the last cycle, you might want to examine the justificaituon for doing so and why that weighs more significantly than the start of the new cycle.
 
Dr. B

From a practical view point, my view is as follows:

If you're a fib trader, and trading daily, or 4 hour bars for example - if the price moves significantly between the end rally bar, and the start rally bar (the next bar), then, when you're making fib measurements or extensions they will be of little value.

In respect of the bouncing and wrecking ball analogy - I see no difference between the 2 - either way in my eyes, the start and the finish occur at the same point. If they don't you have a gap.

Just my 2 cents... you will see it my way eventually Dr. B! :LOL: Have a good evening Monsieur.
 
In respect of the bouncing and wrecking ball analogy - I see no difference between the 2 - either way in my eyes, the start and the finish occur at the same point. If they don't you have a gap.

Just my 2 cents... you will see it my way eventually Dr. B! :LOL: Have a good evening Monsieur.

heheh...ok, this is my last post re this analogy, as i fear my unscientific jabbering is not very beneficial (even less so after a few shandies :cheesy:)

the difference between the two balls is: the rubber ball (i.e. a small market move with low volume and happening over a longer time period), i believe, is more likely to respect a correct fib or well defined S&R level...whereas, the wrecking ball (i.e. a high volume volatile strong market swing happening over a short time period) i believe, is more likely to blast through a fib or S&R, before the market will gather itself and then move back to the 'target' level, probably with the opening on the next bar.

so therefore, the next bar after a big event could be a more realistic representation of where the market feels it should be, thus a better place to place S&R, fibs etc.

again, just me blathering!

also, totally agree with you bramble, there is no 'true' or 'correct' target, just a rough approximation. just been reading how waiting for 'perfect' price targets is a bad habit...
 
Thanks for extra explanation DB. I have to admit I didn't quite understand the logic initially, but now I do.

I will back test your approach, and will stop being so arrogant in the blind belief that my method is better. Until of course I disprove your method ;)

Always good to have an exchange of ideas though, helps keep one on their tootsies. I'm always up for learning something new, hence why I always like to see everyones analysis.

Enjoy the shandies! Laters.

Sorry HW, we derailed the thread a bit... :eek:

Derailed the thread again!:(
What am I going to do with you two?:rolleyes:
Just kidding!
This is nice to see two people going back and forth with some interesting ideas.
The funny thing is the market is what it is.
It is never over bought and it is never over sold. It is always right where it should be.
Remember that all the price of the market is, is a number that represents what people think it should be.
What people think and then act on is what the market is. Always.
Now that doesn't mean that every one gets there way. The boys and girls with the bigger piggy banks get more say.
Both of your idea's and methods of looking at the market could work and be as different as night and day. All you have to do is see what you need to see to make "IT" click for you.
Some one who studies Gann might see the market make a 33% retracement move. That's an important number for the Gann guys and gals.
Some other person will see the same move as a 38% "fib" retracement.
Yet another sees a high bottom.
You can say and do the same thing allot of different ways when it comes to looking at price and time charts.
If you want to be successful at trading (in fact anything in life) you will have to find what works for you.
That's why this back and forth is so good. If you haven't found what you need yet you might just get it from some back and forthing.
Also, you can look at the same thing two different ways and it work for both of you.
Yes I can't wait for them to get the new social group forum up and running cause you two boys really need to start a thread of your own.
World famous it would be.;)
 
^^ wise words there HW.

although the only thread i'd start right now would be called 'Trade the polar opposite of my calls and earn yourself a fortune' :LOL:

to get back 'on topic' then :eek: i'm reading a little about cycles related to natural laws.

when i read the title i thought, 'here we go...', but on reading the mechanics behind some of the methods i found it fascinating.

particularly the ones measuring market cycles by solar flare activity (sun spots), or by mapping the orbital movements of Mars (ingress time studies)!

looking forward to seeing what happens 2moro then chaps as you both have correlating dates of the 26th.

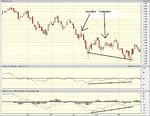
i think we're at an important point, possible double top on the daily FTSE. i've looked at some peoples analysis that predicts a move up over to new highs breaking the strong resistance at 4500, but i can't help but be swayed by my RSI divergence on these two recent highs...we'll see 2moro ey?

EDIT:

here's the chart i posted on the 20th on another thread. i've seen other peoples analysis of other indices showing a similar divergence.
 

Attachments

  • osc div edit.jpg
    osc div edit.jpg
    56.2 KB · Views: 191
Last edited:
^^ wise words there HW.

although the only thread i'd start right now would be called 'Trade the polar opposite of my calls and earn yourself a fortune' :LOL:

to get back 'on topic' then :eek: i'm reading a little about cycles related to natural laws.

when i read the title i thought, 'here we go...', but on reading the mechanics behind some of the methods i found it fascinating.

particularly the ones measuring market cycles by solar flare activity (sun spots), or by mapping the orbital movements of Mars (ingress time studies)!

looking forward to seeing what happens 2moro then chaps as you both have correlating dates of the 26th.

i think we're at an important point, possible double top on the daily FTSE. i've looked at some peoples analysis that predicts a move up over to new highs breaking the strong resistance at 4500, but i can't help but be swayed by my RSI divergence on these two recent highs...we'll see 2moro ey?

EDIT:

here's the chart i posted on the 20th on another thread. i've seen other peoples analysis of other indices showing a similar divergence.


Nice chart!
Let me tell you a little secrete that you may already know.
When you get divergence on an indicator such as MACD, RSI, or allot of others you are using the indicator as a "momentum" indicator.
Any time you have an impulsive move up or down and then a corrective of some kind such as your chart, you will see divergence in you indicator.
I use to love using the MACD with divergence before I learned most of what I now know about timing the markets.
Then one day I realised that I could tell in advance when the MACD would be divergent.
I'm not detracting from your chart, or trying to make you fell like less of a trader but, if you pay attention you will see that what I said above is correct. As a result you will be able to "just" look at price action and know that the indicator would be divergent.
When the market makes a bit of a higher high or a double top and the indicator is making a lower top that means that the momentum of the market is slowing.
All you have to do is look at the market and you should be able to figure that out.
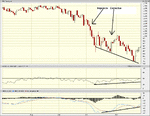
Take a look at the charts I loaded. Then look for it your self.

Remember that the center line is the same as no momentum, or at least the way we use it for divergence.
 

Attachments

  • Divergence1.gif
    Divergence1.gif
    34.3 KB · Views: 278
  • Divergence2.gif
    Divergence2.gif
    33.1 KB · Views: 203
  • Divergence3.gif
    Divergence3.gif
    30.6 KB · Views: 202
hi HW,

i've just been reading about MACD's with a spread indicator (i think that's what you have on your MACD?)

yeah, i'm using a momentum indicator, i don't want to get too messy with my charts, but i'm just beginning with the trading thing and i want to get a rough methodology worked out.

i want to find a good volume indicator to work as non-correlated confirmation to compliment my RSI.

i'm going to digest your charts HW and thanks for sharing your insight. i've only been at this for 6 months so i'm right at the bottom of my learning curve!

You will do just fine I do believe. As you are at the bottom of your curve, in your words, I would like to make a suggestion to you...

Don't use any indicator that you don't calculate your self.

Try to trade with out anything on your chart except the notes you put on it yourself.
Just time, price, and you.
I can't tell you how much time that could save you.
I'm not saying you can't do well trading with indicators from the box (MACD, RSI, and such) but it is much easier (IMHO) to let that all go and calculate some time pivots, in the time frame you like to trade, and then work the price action.

Would you like to be able to look at a naked price chart and have a better idea of whats going on then the dude with all the fancy charts, and colors, and indicators, and lines, and averages, and volume this and that?

If so start now. It will take work but when you get there it's wonderful.(y)
 
Just had a look at the FTSE weekly - last week was a pivot week. I back tested a bit, and on the weekly, the March low pivot was forecast one week early. Just mentioning that so we all don't have preconcieved ideas for trades this week.

Also I looked at GBP/USD - today was a pivot day - there was no higher high today though (that might be a good sign) - it is also a pivot week for GBP/USD. Lets see anyway.

Thanks HW for all the posts, as DB said, wise words! I think I strive for precision in trading, hence obsessive fib measurements! Probably not so wise though...

I am just measuring major swings for these projections btw.
 
You will do just fine I do believe. As you are at the bottom of your curve, in your words, I would like to make a suggestion to you...

Don't use any indicator that you don't calculate your self.

Try to trade with out anything on your chart except the notes you put on it yourself.
Just time, price, and you.
I can't tell you how much time that could save you.
I'm not saying you can't do well trading with indicators from the box (MACD, RSI, and such) but it is much easier (IMHO) to let that all go and calculate some time pivots, in the time frame you like to trade, and then work the price action.

Would you like to be able to look at a naked price chart and have a better idea of whats going on then the dude with all the fancy charts, and colors, and indicators, and lines, and averages, and volume this and that?

If so start now. It will take work but when you get there it's wonderful.(y)

i know that that's where a lot of traders strive to be HW, i.e. reading stripped back charts. i'm just being impatient because my timing is so bad at the moment, i'm looking for some 'snap on' indicators to try to resolve my timing issues...i get frustrated because i can sometimes see swings about to happen, but then make a hash of my entry!

anyhoo...looking forward to the new timing threads coming up :)
 
Yeah, I'm really looking forward to the timing thread now as well! I can see this timing thing become a little obsession for me already. lol!

It's gonna be really tough not being able to trade and review charts for 2 weeks after moving house. It's gonna drive me nuts! At least it will give me some time to re-read some TA books, and prep for the FTP (Fib Time Projection) thread... yes, I am gonna start a thread! OMG - I just hope all the big boys don't kick and bite the little kids, i.e. me :)

they're gonna stick your head down the loo and flush the chain, then nick your dinner money :eek:

lol...i'm sure they'll be absolutely fine mate, you do good analysis with clear explanations. i personally can't wait to learn about timing, as i simply could not BE worse at it!
 
OK, you two need your own comedy show on cnbc!
You can call it "On Track With GeoFrack", or "Your Market Fix With Dr. Blix".

I'm glad to hear that you will be starting the thread after all GF.
Don't worry about "the big boys". Most of them are nice folks who will be more than happy to learn and or contribute.
If someone is being a nasty type I will just have to have words with them.

Dr.Blix,
When the social group forum gets up and running you and I will work on your timing together.
We can start a thread for it as I believe it would be a tremendous help for allot of people including myself.
 
Dr.Blix,
When the social group forum gets up and running you and I will work on your timing together.
We can start a thread for it as I believe it would be a tremendous help for allot of people including myself.

that sounds excellent HW! i imagine it could be really useful for a lot of people too, following my nascent timing bumblings!

keep me posted on the new group forum developments HW.
 
Top