Forex Profit Monster - 4H TF

Choice of pairs

Ivan - I'm in, for sharing experiences with FPM. And thanks for re-starting the thread again.

I started very recently with FPM...after chasing the holy grail for about 6 months - and finding it doesn't exist. From Jim's blog, FPM might just well be the holy grail, but I will need to learn to be patient and follow the rules exactly first.

I'm trading just 4 pairs initially. Want to master the system (and my emotions) before I commit to doing much more. The 4 pairs I'm looking at:

  • GBPUSD
  • GBPJPY
  • EURUSD
  • USDJPY

I'm sticking to the 4H time frame, as I know I cannot sustain the 1H time frame with my family commitments, etc. I am looking at mastering one thing and just keep repeating it to make my long terms profits. I am fine to grow my account slowly...but surely.

And I want to stick to the system. No deviations. I don't need maximum pips...I just need to be positive at the end of the month (for most months anyway).

I'm currently in the short for GBPJPY and it looks like its going side ways at present. Who knows where this will end up...but I'm fine either way. Need to stick to the system...so I'm not going to second guess this thing. I'll let you know how this trade pans out.

Hi Forexsniper - welcome and thanks for adding to this thread mate.

I was recently demo trading the GBPJPY with NVP's (Neil's) Correlation strategy.

I found it was a very volatile pair - the most volatile of all pairs I believe.
As such it was too hot for me to manage.
But on the 4H it may be good. The "noise" - (read: draw-down and whipsawing) is too heady on the 1H TF.

I currently have about 13 pairs I am looking at, but will limit that to Jim's choice of 8 now. Pointless trying to trade everything on the board - and I think your approach is solid, in going with 4 pairs initially. (Not to mention the sparing of CPU resources)

Will get back to this as time permits - but remain committed to getting this working well, and eventually posting trades as they happen.

Best wishes

Ivan
 
Hi folks

Sorry I have been awol, but simply cannot chase 2 rabbits!

I appreciate the time and information you guys are posting, and hope you keep going with it.

I think Davewooldridge's question on exits deserves further exploration, as well as the question of entry. Welcome Dave (again) ... and I hope you can find a bit of time to contribute of you own knowledge here. Personally I am angling to make the FPM my only system, and want to grow the ability to trade it well.

One of the things that I have been considering, is Jim's (the author of Forex Profit Monster) system fundamentals. For him to post results, he HAS to be consistent with the rules. If the rules do not result in a trade, (either profit or loss) then he does not (and can not) claim the profit or loss.

But I want traders of FPM to consider a question that has been deeply troubling me:

How many trades on the 4H have you seen missed because the SLOW TREND was so far behind the FAST TREND, that the trade did not qualify?

So many pips could have been made had the entry been taken when the FAST TREND crossed above the zero line, yet because the SLOW TREND was not quite in place until the close of that 4H candle, the huge rally did not attract our entry.

This has been very frustrating for me for another associated reason:

After the SLOW TREND finally crosses, the major part of that move has been completed.

So finally the trade has all three signals agreeing, and the trade is entered at the opening of the next candle. But then, the trend reverses, stopping us out.

Has this been noticed by anyone?

I am tight for time as usual, but will post a series of charts to illustrate what I am meaning here.

I suspect Jim understands exactly what I am saying here, and I wonder if he has another (personal) trigger he uses in his own trading on these 4H trades.

For the sake of consistency and rule-keeping, FPM system MUST have the 3 matching criteria before an entry is valid. But I can feeling in my bones that there is another way to grab these big pip moves that occur before the SLOW TREND moves over the zero line to confirm entry.

Not trying to rewrite the rules, just trying to optimise the entry for times that the SLOW trend is just ONE candle behind triggering these great trades for us. I want to remain a "purist", yet I am certain we can do better ... cautiously.


Have you considered that perhaps, in the long run, the slow trend saves you from bad entries than not? Because sometimes, a trigger like you talk of the fast trend may look good for a moment but in the long run maybe the slow trend is there for a reason.

I know that in sidways markets, the fact the slow trend takes more time than the fast will usually make you enter at the end of the move... that's what trend following is. It's a matter of testing without the slow and with the slow, but my opinion is long term, the slow adds a bit to the expectation value, saving you from some bad entries
 
The long run

Have you considered that perhaps, in the long run, the slow trend saves you from bad entries than not? Because sometimes, a trigger like you talk of the fast trend may look good for a moment but in the long run maybe the slow trend is there for a reason.

I know that in sideways markets, the fact the slow trend takes more time than the fast will usually make you enter at the end of the move... that's what trend following is. It's a matter of testing without the slow and with the slow, but my opinion is long term, the slow adds a bit to the expectation value, saving you from some bad entries
Hi Sal

Thanks for that input regarding the long run and its importance to survival in operating a system. (I prefer the term "method").

At the moment I am posing the question, because of my frustration in seeing trade after trade triggered, only to find the bulk of the move has passed, or the move reverses after the entry signal finally arrives.

At the moment it is on the table for discussion. I am currently looking over historic trades, and only in the 8 pairs that Jim uses, to try to find whether there is a statistical edge in standing aside until the entry is validated, as he recommends, or getting into the move based on the arrow, plus the fast trend crossing.

What I am hoping to find, is whether we can take a trade when the SLOW trend is only one bar (maybe two bars) away from also crossing

If we enter at a discretionary 2-out-of-3 conditions met, and find the trade begins to run against us, then we would need to manage that trade as per rules, to limit losses as usual. But this may be a phenomenon which is occurring in whipsaw conditions only, and so while doing my back-testing (visually) I would need to see whether the market is trending , or ranging.

And this might be the key ... should we pre-empt entry in a 2-out-of-3 scenario, PROVIDED the ADX Trend Power Indicator is signaling the strength of the trend in the adjacent TF? ie the Daily and Hourly TF.

Forward testing is the best though, because we would also have the use of the Trend Power Indicator, which tells us the state of the overall trend. Unfortunately the TSI only gives readings for the current data, not historic data. One would need to attach an actual ADX indicator when looking over past data, to find the trend condition at time of counting qualifying trades.

Hope I have made that clear enough

What I am saying here, is that there ARE certain market conditions which exist, where it may well be safe to pre-empt the SLOW Trend's crossing the zero, and get into THOSE trades one candle earlier.

Problem: No one has yet figured out a way to tell the market what it should do.

So in a % of those kinds of trades, we are still not going to win.

My proposal is that we look into this statistically, to see if there is a set of conditions where it is "safer" to take trades when 3-out-of-3 conditions are "not quite" met.

In time, I hope to post a few charts to show both sides of the situation.

The bottom line is that I remain a FPM purist, but with an enquiring mind.

Thanks for your interest in the thread - please keep commenting - nice to have as many views as we can.

Best wishes

Ivan
 
Fpm

Hi Ivan,
This is an issue I have discussed a few times with my colleague and remains (by us) unsolved. There is a reason, sure why the SLow Trend is there in the first place, but when you see 70% of the move (and profit) rage along nicely it's not easy. However, at that point, we do not know where we are in the grand scheme of things. In retrospect that's almost 3/4 profit down gone but at the time of judging whether to enter or not, it just seems like 'not right'. I fear to venture into a signal that hasn't qualified and invariably, this is on my part second-guessing the system with an entry to gain more (as opposed to second-guessing an entry to avoid a major pullback).

Maybe I'm just rambling here but perhaps checking what's happening on the higher time-frames BEFORE the SLow Trend catches up (and it is looking like it will 😏) might help. I have increasingly implemented checking D1 and the Weekly when trading on 4H but to be honest, am not in a position to say that this has paid off in the trades I have omitted. I think it depends on the nature of the pair - GBP/JPY and GBP/USD tend to have large moves so these are worthy of second-checking.

And the afore-mentioned checking of the H1 to enter generally is an excellent idea.
I wonder what Jim might say about all this?

Finally, I have to say that I've cleaned up the way I look at FPM - I add only the Traders Dynamic Index to see what's going on and look for divergence. I find this to be an excellent tool. That along with a few trendlines.

Have a good weekend everyone 🙂
 

Attachments

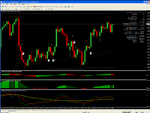
  • FPM.png
    FPM.png
    116.8 KB · Views: 1,702
Extra Profit from the Monster?

Hi Ivan,
This is an issue I have discussed a few times with my colleague and remains (by us) unsolved. There is a reason, sure why the SLow Trend is there in the first place, but when you see 70% of the move (and profit) rage along nicely it's not easy. However, at that point, we do not know where we are in the grand scheme of things. In retrospect that's almost 3/4 profit down gone but at the time of judging whether to enter or not, it just seems like 'not right'. I fear to venture into a signal that hasn't qualified and invariably, this is on my part second-guessing the system with an entry to gain more (as opposed to second-guessing an entry to avoid a major pullback).

Maybe I'm just rambling here but perhaps checking what's happening on the higher time-frames BEFORE the SLow Trend catches up (and it is looking like it will 😏) might help. I have increasingly implemented checking D1 and the Weekly when trading on 4H but to be honest, am not in a position to say that this has paid off in the trades I have omitted. I think it depends on the nature of the pair - GBP/JPY and GBP/USD tend to have large moves so these are worthy of second-checking.

And the afore-mentioned checking of the H1 to enter generally is an excellent idea.
I wonder what Jim might say about all this?

Finally, I have to say that I've cleaned up the way I look at FPM - I add only the Traders Dynamic Index to see what's going on and look for divergence. I find this to be an excellent tool. That along with a few trendlines.

Have a good weekend everyone 🙂

Hi CP1

Thanks for sharing that info.

I have just run the slide rule over the past 2 months of 4H charts to see if there is a way to wring those extra pips out of the setups. So far it looks promising, but I have to warn readers, that 2 months data is not statistical proof in any way, and until the idea is run over the entire 8 pairs Jim recommends, for the entire period under review, then I have to say it is just a theory.

What I did:

* Looked only at signals that were WITH THE TREND
* Looked only at signals since 1st September 2009 to current day
* Looked at difference between entry with all three criteria lining up and only two out of three lining up
* Calculated whether we would have been better or worse off, regardless of whether the trade went on to be a winner (in fact out of 29 trades that were WITH the trend, that I examined, only about 3 or 4 did not result in a profit - that tells us something!)

What I found from that 2 months sample of the 8 pairs:

USDJPY +135
USDCAD +91
USDCHF -22
EURUSD +13
EURJPY +281
GBPJPY +351
GBPUSD +341
AUDUSD +15
____________
TOTAL + 1205 pips extra profit
============

Now I stress that this is a mere 2 months data, and the other 24 months or so may all have been negative - we don't know until we go back and check.

But it does add some confidence to the idea of taking signals that "look" like they will qualify, PROVIDING they are taken WITH the trend, and NOT counter-trend. What I would suggest, is that IF some of you take these trades on 2-of-the-3 signals agreeing, that you also be prepared to close the trade with a VERY tight SL, if it does not perform as expected very soon after entry.

After all - the purpose of "going early" is to grab those bigger moves, and if they do not happen, then be ready to ditch the trade. Knowing that there are a few more pips to be made at the end of the month by going into trades a bit sooner, will soothe a bit of the pain when culling losing trades. If indeed we can get more pips this way, then it SHOULD be much easier (less painful) to cull the rogues.

I hope to go back and find out the comparison or ratio of winners-to-losers of trades taken WITH the trend compared to counter-trend entries. I think it might be a foregone conclusion already that trades taken with the trend will be more profitable/less failed trades. But sometimes these things can surprise.

I hope others can take up the challenge of examining results/data, so we can trade FPM well, and to best advantage.

Always keep in mind that Jim has trialed this software for over a year before going live, and public with it. Our best second-guesses have probably long been tested by Jim ... and discarded. Keep the "pure" method in the back of your mind at all times when tempted to tweak in the way described.

Best wishes

Ivan
 
Thanks for the update and info Ivan! Looks and sounds interesting - I wouldn't be at all surprised if it transpired that there are more pips in it for us... as long as it keeps in with the trend-in-progress (I assume it's an obvious trend on the 4H charts?). Checking D1 and confirming direction would be even more comforting.
I have a question Ivan - roughly how many signals did the system generate whilst not in an obvious trend? How many candles did you count as the minimum for a trend?

Have a great day Ivan and thanks for some interesting analysis - appreciated 🙂
Hopefully time will tell whether anything discovered can be advantageous (and will likewise not conflict with Jim's testing prior to release)
 
Examples

Thanks for the update and info Ivan! Looks and sounds interesting - I wouldn't be at all surprised if it transpired that there are more pips in it for us... as long as it keeps in with the trend-in-progress (I assume it's an obvious trend on the 4H charts?). Checking D1 and confirming direction would be even more comforting.
I have a question Ivan - roughly how many signals did the system generate whilst not in an obvious trend? How many candles did you count as the minimum for a trend?

Have a great day Ivan and thanks for some interesting analysis - appreciated 🙂
Hopefully time will tell whether anything discovered can be advantageous (and will likewise not conflict with Jim's testing prior to release)

Hi Coolpixel1

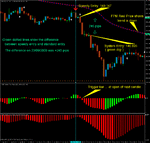
I have posted a chart below to show how the difference is calculated.

I worked out the trend by looking at the "FPM Real Price" which is Blue line with Green dots for uptrend, and Blue line with Red dots for downtrend. When is doubt, I did not use the trade, for simplicity. After all, when there is doubt about the trend, all you can see is the last price on the RHS of the screen. There is no telling whether it will continue or reverse.

All I have done is looked at the NEXT candle at open for the entry, once the big red/green arrow appears, providing either the fast/or slow trend agrees with that arrow direction.

Then I have calculated the correct system entry level, and subtracted the difference.

What I have found through just this one exercise, is that it is no good wasting your time taking every FPM entry, though there will be profits missed for sure.

I'll tell you why.

This past week I entered a live trade with the USDCHF. That was 5th November, and I am STILL in the trade. No it was NOT a FPM trade. But I discovered that pussy-footing around with these trades that are indecisive about direction, just creates tension, stress, and an inordinate waste of time compared with the real profits to be made trading something that really IS going somewhere.

So, when FPM is showing trend is indecisive, I will be thinking very hard about entering - even if I miss a good trade - there are plenty of others. And by entering only in the direction of the trend, I will be whittling down the number of trades that I am waiting to hatch!

I will also be looking, as usual, at adjacent TF to calculate moves/strength etc. But there are so many other good trades in other pairs, that I don't think I could manage all of them, in reality. Not sure whether I will be taking these "speedy" entries - will need to look hard at the statistics, when I can do it thoroughly ... and I will report it back to the thread.

I have removed most of the extra indicators from the chart below, to show more clearly how I arrived at the +245 extra pips.

Another tool I will use, is the pin-bar candle for reversals - if one is present at the end of a pull-back, and the signal is given, then that should lend far more confidence to any decision to enter.

Hopefully this week I will be taking a live trade or two, so will let the forum know how it pans out.

Best wishes

Ivan

EDIT: To answer your question, I didn't count candles to determine trend - I simply looked at the FPM Real Price Indicator. It is very clear. When there is NO TREND, there are NO red or green dots on the blue line. Easy. The FPM is a great system ... no doubt!
 

Attachments

  • gbpjpy.gif
    gbpjpy.gif
    34.1 KB · Views: 2,921
First "real" week

OK folks

Let's see if we can follow along with all 8 pairs this week, and try to catch the 4H setups as they appear.

With me on GMT +10 and others of you on other time-zones, we should be able to monitor the 4H candles as they occur. I am expecting some differences because of the MT4 platforms we all use. Some use the GMT close, and others use the NTSE close for the end-of-day candles.

It won't appear to cause a problem in 1H charts, but it definitely will with the 4H and Dailies. I am using the FXPro platform, which starts the week at 2200GMT Sunday night, I think. That equates to 0600hrs AEST. But this could be way wrong!

Anyway - I have given up on this - with Daylight Saving and different charts using different closing/opening times, you'd have to toss a coin to guess which is correct today! Even when you look at it meticulously, you can still be up to 2 hrs away from "correct" because of who is using what (ie GMT or NYSE) and the +/- of DST.

Moving on ...

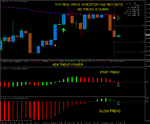
At the open this week, I see only ONE pair ripe for entry: EURJPY, whose chart appears below. In time the "reading" of setups will be second-nature to us, but for now this is what I am seeing:

General: The EURJPY has delivered us a SELL ALERT, as of the second-last 4H candle.
Fast Trend: Dipped below the zero at the last candle.
Slow trend: Dipped below the zero at the last candle too.
Price Trend: According to the FPM Real Price Indicator (Blue Line with Red Dots) the TREND is now DOWN in 4H and lower TF.
ADX: Weak on ALL TF - uncertainty as shown by the whipsawing between 131.00 and 136.00 for the past 8 days. None of the TF on the ADX Trend Power Indicator wants to show the way just now.
Other Issues: We have conflicting Alerts/Triggers right now with this pair. The DAILY chart has a BUY ALERT current, but is waiting for the SLOW trend indicator to agree. Daily chart is still in an uptrend according to the Real Price Indicator - green dots on blue line. I can see that the RSI(14) is turning down, and is UNDER the 50% line, but RSI is not a standard component of FPM - just an add-on by myself. However it is warning that a rally in the daily chart is unlikely in the short term.

The other half of the conflict is the SELL TRIGGER on the 4H TF - and that's the one we are going to use when trading resumes. I notice the RSI(14) is pointing down, and is also under the 50% line. Good!

According to the Fibonacci levels, we have resistance at 133.48 and 134.07.
And we have support at 132.89 and 132.16 and 131.00.

Scenario at open: It is possible that the price could move away from its general trend at the open, until the Asian session comes alive about 3 hrs after the open. Then it is likely that the trend will assert itself and we may see our trade run to early profit.

I will be setting stops at 134.10 which is just above the Fibonacci resistance level of 61.8 \% rally from recent significant low. I may give that level a little more leeway, as the margin there is only about 65 pips. I would be happy with +/- 80 pips SL, which would make the level around 134.30.

Profit targets are: 52 pips, 123 pips and 240 pips, according to which of the Fibs levels you choose as support.

That's it. Keep an eye on the 1H and Daily TF as well - they do give you insight into trend, and can save you many pips if you are aware of what is setting up in those.

The chart is below - I have not drawn in the levels.

I have to say that this is our first trade, and I hope to enter live - unless something about it startles me before-hand!! 😆

So please do not blindly follow this trade without considering your own risk profile and ability to withstand possible losses resulting from a failed trade here. I am certainly recommending AGAINST readers taking this trade, because so much can change in a short time, when following these kinds of setups. Traders should make decisions based purely on their own research NOT rely on anything I have written to encourage their participation here.

In short - if you trade this and lose, it is on your own head. My participation is for road-testing the FPM method, and to do that seriously, I am taking a tiny live position.

Meanwhile, I am expecting other pairs to receive ALERTS too, in the next 36 hours.

Best wishes

Ivan
 

Attachments

  • eurjpy_4h.gif
    eurjpy_4h.gif
    27.3 KB · Views: 1,044
Impressive work Ivan, I'll follow this as much as I can. I have an account with FXPro too (albeit demo!) and funnily enough, had a sell signal on EUR/JPY on Day Monster on Friday, though I probably shouldn't have entered, being Friday afternoon...

I had also decided a while ago to follow the 8 pairs that Jim follows (I was following 12, and 14 at one point but you can't analyze sufficiently well to have so many). I traded EUR/JPY over the summer months quite a bit using FPM on H1 and it went well.

Anyway, I'd be extremely interested to see how this works out because I've seen too many trades have its time by the time I get in. A very important test of things by all accounts 🙂
 
And of course, we have to remember that Monday can be a funny day with the market finding its feet etc. Happy to hear you are using the FPM 'Real Price' as the main trend indicator - different people have different ways of determining this scenario, hence my question. Let's not forget too that if the trade does go awry, then it's only one trade (out of many).
But fingers crossed and good luck 🙂
 
OK folks

Let's see if we can follow along with all 8 pairs this week, and try to catch the 4H setups as they appear.

With me on GMT +10 and others of you on other time-zones, we should be able to monitor the 4H candles as they occur. I am expecting some differences because of the MT4 platforms we all use. Some use the GMT close, and others use the NTSE close for the end-of-day candles.

It won't appear to cause a problem in 1H charts, but it definitely will with the 4H and Dailies. I am using the FXPro platform, which starts the week at 2200GMT Sunday night, I think. That equates to 0600hrs AEST. But this could be way wrong!

Anyway - I have given up on this - with Daylight Saving and different charts using different closing/opening times, you'd have to toss a coin to guess which is correct today! Even when you look at it meticulously, you can still be up to 2 hrs away from "correct" because of who is using what (ie GMT or NYSE) and the +/- of DST.

Moving on ...

At the open this week, I see only ONE pair ripe for entry: EURJPY, whose chart appears below. In time the "reading" of setups will be second-nature to us, but for now this is what I am seeing:

General: The EURJPY has delivered us a SELL ALERT, as of the second-last 4H candle.
Fast Trend: Dipped below the zero at the last candle.
Slow trend: Dipped below the zero at the last candle too.
Price Trend: According to the FPM Real Price Indicator (Blue Line with Red Dots) the TREND is now DOWN in 4H and lower TF.
ADX: Weak on ALL TF - uncertainty as shown by the whipsawing between 131.00 and 136.00 for the past 8 days. None of the TF on the ADX Trend Power Indicator wants to show the way just now.
Other Issues: We have conflicting Alerts/Triggers right now with this pair. The DAILY chart has a BUY ALERT current, but is waiting for the SLOW trend indicator to agree. Daily chart is still in an uptrend according to the Real Price Indicator - green dots on blue line. I can see that the RSI(14) is turning down, and is UNDER the 50% line, but RSI is not a standard component of FPM - just an add-on by myself. However it is warning that a rally in the daily chart is unlikely in the short term.

The other half of the conflict is the SELL TRIGGER on the 4H TF - and that's the one we are going to use when trading resumes. I notice the RSI(14) is pointing down, and is also under the 50% line. Good!

According to the Fibonacci levels, we have resistance at 133.48 and 134.07.
And we have support at 132.89 and 132.16 and 131.00.

Scenario at open: It is possible that the price could move away from its general trend at the open, until the Asian session comes alive about 3 hrs after the open. Then it is likely that the trend will assert itself and we may see our trade run to early profit.

I will be setting stops at 134.10 which is just above the Fibonacci resistance level of 61.8 \% rally from recent significant low. I may give that level a little more leeway, as the margin there is only about 65 pips. I would be happy with +/- 80 pips SL, which would make the level around 134.30.

Profit targets are: 52 pips, 123 pips and 240 pips, according to which of the Fibs levels you choose as support.

That's it. Keep an eye on the 1H and Daily TF as well - they do give you insight into trend, and can save you many pips if you are aware of what is setting up in those.

The chart is below - I have not drawn in the levels.

I have to say that this is our first trade, and I hope to enter live - unless something about it startles me before-hand!! 😆

So please do not blindly follow this trade without considering your own risk profile and ability to withstand possible losses resulting from a failed trade here. I am certainly recommending AGAINST readers taking this trade, because so much can change in a short time, when following these kinds of setups. Traders should make decisions based purely on their own research NOT rely on anything I have written to encourage their participation here.

In short - if you trade this and lose, it is on your own head. My participation is for road-testing the FPM method, and to do that seriously, I am taking a tiny live position.

Meanwhile, I am expecting other pairs to receive ALERTS too, in the next 36 hours.

Best wishes

Ivan

Ingot, I remember you talking 4H charts may be a struggle for you... have you instead giving a try to 6H or even 8H charts?

I bet you could follow it more consistently... I know in terms of opportunities not many would arise but at least it's better than the dailies and you'd be able to follow them consistently...

I assume Australia is +10GMT therefore 8H candles for example would be under FxPro being closed at 0800 AM , 4PM, and midnight

Seems very balanced to me... if instead we were talking 6H candles, it turned out to be closes at:

8 AM; 2PM, 8PM, 2 AM

Hi Sal

Yes - I recognise that longer term action is much easier to assimilate, but I am going to persevere with the 4H and Daily charts. FXPro opened its data 35 mins ago - it's 0835hrs here (0835am AEST) so for the past 90 mins I have been keeping an eye on IG Markets data, though their charts are rubbish from the "Pure Deal" platform, unless you use their tiresome-to-load "Advanced Charts".

IGM charting need a rocket under them, to use a euphemistic term for my real thoughts! Wouldn't you think that in this day and age, with the millions of profits they make, that they would take state-of-the-art charting as a priority? Take some of the eMini trading platforms - you can trade 100% from the screen, set or change TP or SL or contingent orders, or open/close instantly without having to open boxes and read confirmation messages that take valuable seconds.

It's pure rubbish from such a prominent operator. And their "best" platform is NOT AVAILABLE to GSLO clients - how absurd and discriminatory! I definitely have ambivalent feelings about IG Markets - it's the Stockholm Syndrome in my case! http://web2.airmail.net/ktrig246/out_of_cave/sss.html

While I am on the subject of charts - IG Markets use a 3rd party to supply their charting, and the data often DOES NOT MATCH, so be very careful if you are trading off their electronic platform prices, and NOT their chart prices - that has cost me in the past, in that IG Markets may have widened the spread to close out one of my positions.

I have screen-shot evidence that the tick-price didn't get to the level I was closed out at, but of course that's another story. Short of going to the FSA or FICS, IGM don't want to know about your losses.

Still - in the absence of a half-decent competitor, I have to use them here in Oz, because the others want to charge commissions, or a roll-over fee, or higher libor. I won't go off-shore for a broker because of sovereign risk in the event of a bankruptcy or solvency crisis.

Let's just say be careful of widening spreads when close to your stops. DO NOT TRUST IGM CHARTS.

All that to say that I am far better off trading the higher TF like 4H instead of 15 minutes, and having nice wide SL levels. But I like to have a few trades happening, so the DAILY charts are a bit slow for me - I will trade them when they set up though.

Further, I would need to go to OANDA I think, in order to get the unconventional 2H and 8H charts. I do not know of any MT4 files I could use to convert data to 2H or 6H or 8H candles on MT4. It wouldn't be hard to write a file to do it - but such a challenge is beyond my skills.

Good to have you on the thread, Sal. I saw you over at Donna Forex FPM thread too I think. (That thread has gone a bit quiet)

Anyway - thanks for those suggestions - trading the 6H or 8H would be better for work/sleep reasons for sure. But on the 4H we would need to take the good with the bad, and have TP and SL in place in case of faster moves in our absence.

best wishes

Ivan
 
Last edited:
Hi Sal

Yes - I recognise that longer term action is much easier to assimilate, but I am going to persevere with the 4H and Daily charts. FXPro opened its data 35 mins ago - it's 0835hrs here (0835am AEST) so for the past 90 mins I have been keeping an eye on IG Markets data, though their charts are rubbish from the "Pure Deal" platform, unless you use their tiresome-to-load "Advanced Charts".

IGM charting need a rocket under them, to use a euphemistic term for my real thoughts! Wouldn't you think that in this day and age, with the millions of profits they make, that they would take state-of-the-art charting as a priority? Take some of the eMini trading platforms - you can trade 100% from the screen, set or change TP or SL or contingent orders, or open/close instantly without having to open boxes and read confirmation messages that take valuable seconds.

It's pure rubbish from such a prominent operator. And their "best" platform is NOT AVAILABLE to GSLO clients - how absurd and discriminatory! I definitely have ambivalent feelings about IG Markets - it's the Stockholm Syndrome in my case! http://web2.airmail.net/ktrig246/out_of_cave/sss.html

While I am on the subject of charts - IG Markets use a 3rd party to supply their charting, and the data often DOES NOT MATCH, so be very careful if you are trading off their electronic platform prices, and NOT their chart prices - that has cost me in the past, in that IG Markets may have widened the spread to close out one of my positions.

I have screen-shot evidence that the tick-price didn't get to the level I was closed out at, but of course that's another story. Short of going to the FSA or FICS, IGM don't want to know about your losses.

Still - in the absence of a half-decent competitor, I have to use them here in Oz, because the others want to charge commissions, or a roll-over fee, or higher libor. I won't go off-shore for a broker because of sovereign risk in the event of a bankruptcy or solvency crisis.

Let's just say be careful of widening spreads when close to your stops. DO NOT TRUST IGM CHARTS.

All that to say that I am far better off trading the higher TF like 4H instead of 15 minutes, and having nice wide SL levels. But I like to have a few trades happening, so the DAILY charts are a bit slow for me - I will trade them when they set up though.

Further, I would need to go to OANDA I think, in order to get the unconventional 2H and 8H charts. I do not know of any MT4 files I could use to convert data to 2H or 6H or 8H candles on MT4. It wouldn't be hard to write a file to do it - but such a challenge is beyond my skills.

Good to have you on the thread, Sal. I saw you over at Donna Forex FPM thread too I think. (That thread has gone a bit quiet)

Anyway - thanks for those suggestions - trading the 6H or 8H would be better for work/sleep reasons for sure. But on the 4H we would need to take the good with the bad, and have TP and SL in place in case of faster moves in our absence.

best wishes

Ivan


Ivan, I told you about the 8H or 6H charts because it would fit your schedule, and your sleep better than 4H that are too demanding for a person that is not a full time trader in my opinion.

Mr Salvador to the rescue:

Here's how you turn your MT4 into whatever charts you need 😉

check here: http://www.trade2win.com/boards/for...37134-sniper-forex-system-277.html#post953284
 
Actually here's this:

I uploaded the expert Period Converter... and there's the template.

Just open 8 charts of H1 for each pair you wanna trade, load the template into each one.

Then for each pair you need to go File -> Open offline and then open the corrsponding H8 chart for each pair.

Then on the offline charts just load whatever template you want - FPM templates for example. Let the other charts naked since you won't be using them.

Then I advise for you to save the profile so that you can get that setup everytime you want with only one click.

If you need help read the previous link I gave you
 

Attachments

Actually here's this:

I uploaded the expert Period Converter... and there's the template.

Just open 8 charts of H1 for each pair you wanna trade, load the template into each one.

Then for each pair you need to go File -> Open offline and then open the corresponding H8 chart for each pair.

Then on the offline charts just load whatever template you want - FPM templates for example. Let the other charts naked since you won't be using them.

Then I advise for you to save the profile so that you can get that setup everytime you want with only one click.

If you need help read the previous link I gave you

Thanks for that Sal - you're worth your weight in diamonds mate.

I went to the previous link and got this message:

"PHP has encountered an Access Violation at 018F5AE8" so I am thinking maybe the page is only available to log-in access? But I will use the files you have generously posted here Sal, and see how it turns out.

I entered one mini contract short the EURJPY @ 133.578 and although it did run against me initially for about 10-20 pips, it has since come back into profit of about 20 pips. Nothing really ... so we simply wait until this 4H candle closes before getting excited about taking any specific action.

btw - I realised after I wrote that long-winded post above, that you were trying to help me out with alternative TF.

Best wishes

Ivan
 
Other setups to watch:

Scanning through the other 7 pairs just now, I notice that:

USDCAD 4H has its SLOW Trend about to cross above the zero line, which will trigger a LONG entry. But we still have a couple of hours to go for that 4H candle to complete, so be patient.

USDJPY 4H triggered an entry SHORT @ 90.116 and is currently 26 pips in profit. It is possible to grab an entry on this one if you think it has legs.

USDCHF 4H triggered a SHORT entry @ 1.01643 and is currently 5 pips in profit. I am already in this trade, but it is range-bound.

EURUSD triggered an entry LONG @ 1.48420 and is currently about 40 pips in profit.

GBPJPY triggered a LONG entry @ 150.149 and is currently also about 40 pips in profit.

GBPUSD triggered a LONG entry @ 1.65220 and is currently also about 140 pips in profit.

AUDUSD triggered a LONG entry at .91008 and is currently also about 135 pips in profit.

Those are the trades the FPM is in right now, so we just have to be patient. Opportunity is still there to enter some that have not moved much yet, but I would allow them to pass - there may be good reason why these didn't move into profit quickly.

Best wishes

Ivan
 
which one gives the PHP error? the t2w one or the other one?

I forgot to mention the templates I gave are for the 8H, if you want another time frame just go to the expert properties and change the multiplier, that I think is set to 8. The multiplier, as the name indicates, multiplies the "online" charts by whatever number you put in... hence the need that naked charts have to be H1 or H4 (but here you had to change the multiplier to 2) I think you already got the handle of it.

HI Sal

I now have 24 charts on the lower tool-bar!

My 8 usual pairs, plus 8 of 1H of each (naked) plus the 8 of 8H (offline).

1) I saved the profile
2) When I apply the profile to any "live" chart, it will only load the offline version - and is not linked to data changes. I suspect this is OK because we only want to view the offline chart to analyse for setups.
2a) How do I get "fresh" data onto these 8H charts to update every 8 hrs?
3) Can I delete the naked charts after saving the profile? This would leave me with my usual 8 charts, plus 8 offline charts.

To answer your question above - this is the link that is giving the error message:

http://codebase.mql4.com/276

best wishes

Ivan

PS - I would like to be able to have "live" charts (accepting data) in the 6H and 8H and maybe 12H TF, instead of the offline ones ... is there a way to alter the MT4 platform to display this? (ie through a mq4 files etc)

Igor, the data is streamed to the offline charts from the H1 naked... so you need to keep the H1 naked open.

For example if I would want to trade with FPM, I'd need 16 pairs open.

8 for H1 loaded with the template I gave you (this template loads the script of the periodconverter into the chart), and then open 1 offiline chart for each pair loaded with whatever template we want... FPM or anything else.

If you don't close the H1 charts, the data will be streamed live into the H8 ones.

Hmmm.

I have kept the 1H naked charts open, but the data is not updating into the 8H offline charts.

I may have to go back and repeat the exercise, to ensure I have not missed anything.

Will keep you posted.

Cheers

Ivan
 
Back
Top