Best Thread Firewalker's Journey: A path of discovery in search for enlightenment

Status
Not open for further replies.
FX_Cowboy said:
I really don't have any deep insight to offer here. At the time the chart was made, price had failed to break out through resistance that had held for quite some time, and had retraced to a support area. In other words, for the last day or so, price had been falling (look at the first bar from 7/31 and compare to the last bar printed on the chart).

Given that scenario, I would not be considering a long for the sole reason that I see no indication that price will head back up again. Sure, price was at a level that had provided support in the past -- and also had been broken in the past. But price breaks through support and resistance levels all the time. All I was saying was that there was no indication (that I could find) for a long, so I would not have initiated a long at that point. I should add that I certainly did not know at that point that price would continue to fall either (perhaps a more experienced trader could have seen that coming). So, with no reason to initiate either a long or short position, I would have waited for some reason to enter a trade.

Thanks for answering that question, so I can state that "absence of evidence" was evidence to NOT enter a trade. I understand what you're saying. Could you let me know your comments on my charts of today? It just looks quite similar situation there...
 
firewalker99 said:
Thanks for answering that question, so I can state that "absence of evidence" was evidence to NOT enter a trade. I understand what you're saying. Could you let me know your comments on my charts of today? It just looks quite similar situation there...

It looks like a nice up trend. I hope you're long. :cheesy:

Seriously, I'm not sure what you want me to comment on. And I'm not sure I catch your meaning concerning the similarities. How do you see the situations being similar?
 
FX_Cowboy said:
It looks like a nice up trend. I hope you're long. :cheesy:

Seriously, I'm not sure what you want me to comment on. And I'm not sure I catch your meaning concerning the similarities. How do you see the situations being similar?

Well, perhaps I didn't put it as cleary but what I meant is I thought I saw a similar situation as yesterday on the monthly chart after that air pocket as dbphoenix mentioned a high probability short.

* air pocket appearing at 1100 -> air pocket on 07/28 just past the middle of the day
* following bars aren't able to reach much higher -> same here
* volume drops and price moves down slowly on 07/31 -> same here between 1100 and 1200
* it has been an uptrend from 07/24 till 07/31 -> uptrend from start of day

If I'm seeing things that just aren't there, please point out so.
I took a long entry at 09:30 actually... (but got out of the trade by that down spike around 10:15)
 
firewalker99 said:
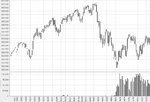
You called this a high probability short. Could you elaborate on that? What are the signals that make you say that? You name it "air pocket"... Incidentally I thought I had a similar situation today. Let me start by posting a chart of the last month, with yesterday's down move.

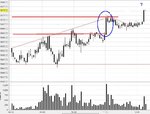
Ok, next is an intraday chart where I see an uptrend. Around 1100 there's a bozo on high volume. Also an "air pocket" or what is your definition of it? Not that I trade those, but anyway, the day opens with an up gap as you can see on the 2-day 5min bar chart. Next (after 1100) price drops gradually on low volume. Well, if I take everything you've said and compare it with the monthly chart, I've got 3 exact same signals. So, I guess I'd short. But as you can see, price only keeps moving up further.

Yes, no two situations are the same, everything has to be looked at in the right context.
But I'm not learning anything if for every situation there's a example pro and one contra...

Sorry, but you're showing me three charts which appear to be unrelated and which have no annotations that relate to what you're asking, so I don't know what you're looking at or what the focus of your question is.

As to the "air pocket", I erred in assuming that that, plus the S/R line you'd drawn, was the reason why you took the short. Since that had nothing to do with it, please explain why you did take that short.

Incidentally, your second chart has no date, so I don't know the context.

Db
 
dbphoenix said:
Sorry, but you're showing me three charts which appear to be unrelated and which have no annotations that relate to what you're asking, so I don't know what you're looking at or what the focus of your question is.

Db

Sorry, I'll fill in the blanks and edit the original post.
I left out any annotations because I'd wanted to leave them blank as you could make your comments on them without my S/R, trendlines, etc interfering...

dbphoenix said:
As to the "air pocket", I erred in assuming that that, plus the S/R line you'd drawn, was the reason why you took the short. Since that had nothing to do with it, please explain why you did take that short.

Db

Mainly I shorted because that support was broken with a large down bar on higher volume, it went under by more than 5 points and then I shorted when it retraced a little back to 5720 (around 9:25)

dbphoenix said:
Incidentally, your second chart has no date, so I don't know the context.
Db

That one is of today
 
Last edited:
trying my hand at interpreting volume

Russell 2000 chart

with and without annotations
 

Attachments

  • 20060802-er2.JPG
    20060802-er2.JPG
    113.4 KB · Views: 278
  • 20060802-er2p.JPG
    20060802-er2p.JPG
    126.4 KB · Views: 366
chart analysis

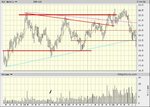
I've attached my comments on a chart of dbphoenix (see his appendix) with my lines indicated in bold red. db, I left your lines on it, but the purple line is only made up of two points?
The smaller led lines are just crossed up/down multiple times, also volume remains quite constant on most of the bars...

I also added a small red line, where I find more action because it goes through it and then reserves just to touch it slight and move away from it again.

The cyan line is one I'd also be drawing, but as for the rest...?
 

Attachments

  • converging.JPG
    converging.JPG
    79.9 KB · Views: 344
The pink line is a supply line. The blue line is a demand line. In this case, they show a hinge (see post 44 in the PV thread). I don't always draw every S/R line, esp if I can see them without drawing them, such as when they're obvious, as here.

In this case, price breaks out of the hinge in Nov '05. It retests the hinge, then makes another try. This doesn't get anywhere either and returns to the hinge. In these cases, price often exits the opposite side, as here. The red lines (uploaded as brown) were drawn across points that had been repeatedly tested. The lower one turned out to provide temporary S last June. The upper one also provided R in the same month.

As for future S, each succeeding swing low on the way down might provide some S, like falling down the stairs, but who knows? I'll see what happens if and when we get there.

I don't pay any attention to the volume. But it's too much trouble to cut.

Db
 
firewalker99 said:
Sorry, I'll fill in the blanks and edit the original post.
I left out any annotations because I'd wanted to leave them blank as you could make your comments on them without my S/R, trendlines, etc interfering...

I'm beginning to lose track of where we are. I still don't know what you want me to look at in the three charts you posted. The "air pocket" I referred to occurs near the end of the day before you entered your short.

Note in the chart below that there are no trades in this area for at least several days. This is in part what enables price to rise so far so fast. Because there's so little support within that pocket, traders will try to find S as price makes the return trip, but the probabilities lean toward a drop toward the bottom of the pocket. Apparently, it's already well below that (it's difficult to tell since not all your charts have dates on them, so I'm not sure what goes where).

Db
 

Attachments

  • fw.jpg
    fw.jpg
    52.5 KB · Views: 342
dbphoenix said:
And . . .

In the previous post, you said you sometimes leave out the S/R lines when they're obvious.
Well perhaps they aren't so obvious to me, take this chart, why not draw a supply line now instead of a resistance like the purple one in the previous chart I mentioned.
 

Attachments

  • fw1.JPG
    fw1.JPG
    26.8 KB · Views: 296
dbphoenix said:
The pink line is a supply line. The blue line is a demand line. In this case, they show a hinge (see post 44 in the PV thread). I don't always draw every S/R line, esp if I can see them without drawing them, such as when they're obvious, as here.

In this case, price breaks out of the hinge in Nov '05. It retests the hinge, then makes another try. This doesn't get anywhere either and returns to the hinge. In these cases, price often exits the opposite side, as here. The red lines (uploaded as brown) were drawn across points that had been repeatedly tested. The lower one turned out to provide temporary S last June. The upper one also provided R in the same month.

As for future S, each succeeding swing low on the way down might provide some S, like falling down the stairs, but who knows? I'll see what happens if and when we get there.

I don't pay any attention to the volume. But it's too much trouble to cut.

Db

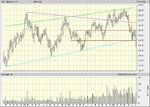
I'm not sure if I'm following though. You said I should look for points where price interacts more than usual. Then for me this means look at volume and see if it increases, decreases are stays the same for a couple of bars. It also means check if bars are small or widespread, are the wicks long, small in comparison to the bodies and how frequently that point is being passed from the down- or upside.

From my point of view, I'm not seeing a hinge at all, I see an uptrend perhaps at best. Because the lows are higher each time, and the highs keep reaching higher (green line). If they're are so many ways of interpreting a chart, how can I possibly develop an entry strategy if I'm at a loss to distinguish is price is trending up, ranging between S/R or something else?
 

Attachments

  • converging.JPG
    converging.JPG
    78.4 KB · Views: 274
Last edited:
dbphoenix said:
I'm beginning to lose track of where we are. I still don't know what you want me to look at in the three charts you posted. The "air pocket" I referred to occurs near the end of the day before you entered your short.

Note in the chart below that there are no trades in this area for at least several days. This is in part what enables price to rise so far so fast. Because there's so little support within that pocket, traders will try to find S as price makes the return trip, but the probabilities lean toward a drop toward the bottom of the pocket. Apparently, it's already well below that (it's difficult to tell since not all your charts have dates on them, so I'm not sure what goes where).

Db

I was trying to point out that a similar situation occured intraday basis. As you mentioned you found that after the air pocket there was a high probability short. I assumed that was because of the lack of support within the pocket as you mentioned plus the sudden high volume up marubozu.

Now I attached both charts. I don't know if I can find two charts that look more the same than that... At the first weekly chart there's the air pocket near the end of the day as you pointed out (btw are you implying timing makes a difference?). At the second chart (2nd August 2006) these are the similarities I see:

- airpocket at 1100
- uptrend before
- zip support in pocket
- decline in volume after airpocket (retracement)

Instead of dropping down further, it actually moves up a higher around 1215.
You said I'm perhaps looking at too many things, so I took volume out of the equation but left it on the chart.

In hindsight didn't volume give me a hint? On the first weekly chart the airpocket was filled with volume that amounted to the double of previous top -> extremely high volume, warning sign. On the second chart volume @ 1100 was the same, but at 1215 it made a higher top with lower which indicates possible end of the uptrend.


I need to know whether I'm going in the wrong direction here, so you may be blunt and say so if that's the case.


dbphoenix said:
Apparently, it's already well below that (it's difficult to tell since not all your charts have dates on them, so I'm not sure what goes where).

Yes, I've attached a new monthly chart in next post where you can see it went all the way to 5612.
 

Attachments

  • nolines.JPG
    nolines.JPG
    154.3 KB · Views: 320
  • 20060802-b.JPG
    20060802-b.JPG
    133.9 KB · Views: 275
  • daxyearly.JPG
    daxyearly.JPG
    169.8 KB · Views: 275
  • dax3months.JPG
    dax3months.JPG
    213.6 KB · Views: 250
Last edited:
Allow me to address this BOZO (High Volume up or down bars, where open and close are at opposite ends) issue:

1. First of all the 2 charts of on different timeframes, the left I guess 60min, the right on 5min.
2. Volume considerations do play a significant role in such circumstances especially in respect of important support/resistance levels. However the principles of Selling and buying pressure applies across the board , on any time frame and in any liquid market.

3. POTENTIAL WEAKNESS APPEARS ON UPBARS ESPECIALLY IF THERE IS HIGH VOLUME
Whether it will reverse from here to form a downtrend or simply retrace and continue depends on the bar formations and accompanying volume on the ensuing bars as they unfold.

4. The Bozo in question is on the 28th of July, bring up a 120min chart and if you look left there is huge congestion zone between 5700-5750 , that is the potential supply area, so initially the Bozo suggested that all that selling emerged from that zone where traders were locked up. This then is the first sign of shorting opportunity.
5. Now if you drop down to say 30min or 15min bars from then on, you will notice lots of downbars on high vol, followed by markup in prices which culminate on narrow upbars on low volume (NO DEMAND) and also supply coming in at lower price levels, This can be termed as a mini distribution phase
6. The best trading opportunity under these conditions come in the form of an Upthrust, where the prices are marked up to catch stops and prices then reverse, refer to a 15min chart and look at the bar at22hrs on the 28th, similarly the 14.45bar on the 1st August.

7. As for the 5min chart of the 2nd August, the scenario is different, there is a support level at 5665, the upbar on high vol (BOZO) at 11.05 is a potential signof weakness, however if you observe closely the retracement is on low vol (reduction in selling pressure, followed by a hammer on high vol, suggesting demand has entered the market, this is then followed by few bars up and further testing on downbars, however to observe this you will have to drop down to a 3min or 2min where these downbar testing low volume are clearly evident, This then now is a sign of strength and a low risk, highprobability long trade,does not automatically indicate that prices are going to rocket skyward but your target to the previous swing high i.e 5670 is viable, afterthat a traders trade management skill has to take over.

Will try to get the charts in word doc if you wish and attach later
 
SIMA said:
First of all the 2 charts of on different timeframes, the left I guess 60min, the right on 5min.

The second one is actually a 3min chart.
Don't mean to give you a hard time on this, but I'm really seeing something else...
:rolleyes:

SIMA said:
POTENTIAL WEAKNESS APPEARS ON UPBARS ESPECIALLY IF THERE IS HIGH VOLUME

I would agree, but only if volume were extremely high.


SIMA said:
4. The Bozo in question is on the 28th of July, bring up a 120min chart and if you look left there is huge congestion zone between 5700-5750.

That's like looking back 5 weeks... does that supply area still hold then?


SIMA said:
If you drop down to say 30min or 15min bars from then on, you will notice lots of downbars on high vol, followed by markup in prices which culminate on narrow upbars on low volume (NO DEMAND) and also supply coming in at lower price levels,

What I'm seeing is are indeed a lot of down bars, but almost all of them succeed in closing in the middle or on top, that's a sign of strenght because it appears on downbars. then you have volume rising on some wide spread up bars. I agree in the end the narrowupbars but volume is always that calm near the end of DAX trading because it'll be 21-22 o' clock then...


SIMA said:
If you observe closely the retracement is on low vol (reduction in selling pressure, followed by a hammer on high vol, suggesting demand has entered the market, this is then followed by few bars up and further testing on downbars, however to observe this you will have to drop down to a 3min or 2min where these downbar testing low volume are clearly evident,


This chart is actually a 3min chart. Where do you see those signals then, I'm mostly seeing upbars with shadows on the upside equal or greater than the body, should that be a sign of weakness?
You're saying it's a retracement on low volume, but take a look at my first chart, volume is gradually dropping also so why isn't that a retracement?
 
firewalker99 said:
In the previous post, you said you sometimes leave out the S/R lines when they're obvious.
Well perhaps they aren't so obvious to me, take this chart, why not draw a supply line now instead of a resistance like the purple one in the previous chart I mentioned.

You could. Either way, 5700 seems to be the number to beat. Back off to a two-year weekly chart.
 
It is easy to get mixed up with this Volume analysis when viewing different timeframe charts.
It is a fractal effect, and a retracement on say 60min or 120min would appear as a major weakness or reversal on 3min/5min chart. ie. you will observe a down trend with reverse retracement containing No Demand bars i.e selling opportunities, and vice versa

Also terms like high vol, low vol, weakness, strength are relative, best not to dwell on absolute number and then try to transpose those figues from one timeframe to the other. The signals based on Price/Volume or Volume Spread Analysis appear in varying intensities.

You take your cue from the higher time frame and then consider entry from a lower time frame.
eg. when that bozo appeared on the 60min chart, you did not have the hindsight luxury of viewing the retracement on low vol.

At that point you drop down to lower time frames and work from there.

When we see peaks in Volume it is evidence of potential resistance to the prevailing trend, we can never know whether the market will go up or down, it all depends on the strength of the buying and selling forces at the time.

By the way professionals not only look at price actions a few weeks back, some go months and even years.
All I can suggest here is to post your own chart preferably one time frame say 5min and the other 60min for observing longer term trend, and identify your own setups to go long or short which should be from the 5min chart, then we can have a look, otherwise it would lead to real confusion if we all keep pasting different charts

Perhaps Db might have something to add
 
firewalker99 said:
I'm not sure if I'm following though. You said I should look for points where price interacts more than usual. Then for me this means look at volume and see if it increases, decreases are stays the same for a couple of bars. It also means check if bars are small or widespread, are the wicks long, small in comparison to the bodies and how frequently that point is being passed from the down- or upside.

From my point of view, I'm not seeing a hinge at all, I see an uptrend perhaps at best. Because the lows are higher each time, and the highs keep reaching higher (green line). If they're are so many ways of interpreting a chart, how can I possibly develop an entry strategy if I'm at a loss to distinguish is price is trending up, ranging between S/R or something else?

As you say, for you this means including volume, which I've suggested you set aside for the time being. You're also examining the bars at a microscopic level, attaching far too much importance to any given bar. You're focusing on the trees, not the forest.

As for the hinge, it is drawn according to the action as of October '05. The fact that price breaks out of it in November does not alter its potential importance.

As for how you're going to learn all of this, I've suggested that you not examine so much all at once. And as far as the hinge example goes, I didn't introduce it; you asked about it. If you can't focus on only one or two things at a time, preferably only one, you're going to become frustrated to the point where you abandon the entire effort.

So, again, if you want to learn S/R, set aside volume and any diagonal lines for now. Learn to read charts left to right. Start, if you lke, with the chart I posted to the S/R thread.

Db
 
firewalker99 said:
I don't know if I can find two charts that look more the same than that...

You said I'm perhaps looking at too many things, so I took volume out of the equation but left it on the chart.

They may look the same, but one of them covers several weeks. The other covers two or three hours. Plus you don't include the context for the second chart, making interpretation somewhat meaningless.

We seem not to be communicating on the volume thing. You're not removing it at all, you're just holding it behind your back. But, it's your journal, and it really isn't my place to tell you how to proceed.

Db
 
SIMA said:
Wonder who or what basis somebody decided to stick that Rookie label against my name:))

Anyway Firewalker if you are really struggling with this Volume business, best to have a look at Pattern Based trading and then gradually incorporate volume analysis later on. Try http://www.rsofhouston.com/
It takes time for this click in place but if you persist , it will be worth it.

Yeah, rookie would be more suitable for me considering my (lack of) progress.
Anyway, keep posting some more :)

as for the link, I'm being a bit skeptic as the state you can be "making big money in one month from now" and statements in the likes of "Become a Successful Trader – This Will Be The Last Trading Course You'll Ever Need!" I don't think the learning process ever stops...
 
Status
Not open for further replies.
Top