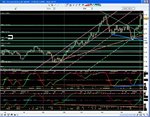
Fibonelli's examples of divergence and confluence

fibonelli

Experienced member
Messages
1,338
Likes
288
This thread is to illustrate examples of price divergence which

1. Enable re-entry into an existing trend; and
2. Enable entry into a new trend following a pattern failure.

These are my two methods which I am currently testing. For full details, see my blog, entry number #15.
 
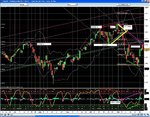
Here's a super example of multiple divergences on the Nasdaq Composite.

The failure of the Bullish Trend Continuation Divergence (light blue line) lead to a break below the Ascending Triangle (very thick yellow line) chart pattern.

Before this failure, there was a bearish regular divergence (red line) giving a warning of a possible trend reversal due to decreasing trend momentum. The sequence of candles also became bearish eg a number of large red candles and a lack of large solid green candles.

Price then found support at the higher end of the 2500-2540 RBS pivot zone. The decreasing momentum of decline caused a bullish regular momentum divergence and a bullish falling wedge chart pattern developed.

Price then broke above the bullish falling wedge as theory suggests.

Price (high=2696) met resistance at the:
50% fibonacci retracement @ 2700;
Upper descending (tentative) trendline @ circa 2698;
SBR pivot zone of 2698-2720; and
Big round number of 2700.

There was also a reversal after an opening gap up on Fri 30 Nov. Price came close to the upper Bollinger Band.

This reversal has now formed a Bearish Trend Continuation divergence (see purple line). Price should go down to say, 2540 in the first instance. Failure is above 2698 (alt: above 2720).

Risks are in the 2630 relatively minor RBS level and holding as support and that the signal is at the bottom of the SBR pivot zone of 2698-2720.
 

Attachments

  • Nasdaq Comp Daily 301107.JPG
    Nasdaq Comp Daily 301107.JPG
    272.3 KB · Views: 2,273
Last edited:
Hey fibba,

Very good post by the way.

Do you mind me asking if you spend more time testing out strategies that actually exercising them? ;)

I ask this because I see you refer to 'backtesting' or just 'testing' very frequently on these boards.

Do you find looking at what has happened before and assuming it will happen again (despite the economic climate) successful? I use very little TA in my trading and focus on support/resistance and economics.

This isn't any form of 'dig' at you BTW but I am interested how successful your strategy is (when you get round to placing real trade's that is ;) )and what instruments you find the most success with?

JK

JK,

If you read my blog (entry number 15) you will see that I have been learning TA for exactly 1 year.

I believe it is entirely normal in a journey of learning a completely new skill, that you will continue to learn new aspects of TA and disregard other areas of TA and different methods through a process of trial and error of what works and what doesn't.

In terms of my strategy. It is entirely technical in nature. I assume that all relevant information is included in the price of a security. I do however, pay attention to econ news announcements and keep an up to date strategic overview of the current market themes (eg "credit crunch", "stagflation", "carry trade", "dollar weakness") so I'm not caught out by any high level decisions.

I've been very fortunate in discovering a method that:

1.Has a positive expectancy based on the sample size and ongoing observations of taking all signals without any filtering. The problem with taking unfiltered signals is that a sequence of losses can occur;
2. Other traders on this forum and on other forums are using their own specially filtered method which also generates a positive expectancy.

I'm testing the method across a selection of instruments and at different intervals and different levels of volatility. The objective is of filtering out the consistently poor signals by the appropriate use of TA techniques including multiple time frame analysis.

The key to the method is the identification and evaluation of the strength of support/resistance levels and of trend just like the other traders I've observed are doing.

I also aim to write a screener and maybe an indicator.

The whole purpose of this filtering is to avoid trading a pretty pattern on its own.

I treat trading as a business and therefore I must be able to understand my product in full. My product is my two trading methods which I take to the "market" to trade with the aim of making net profits with an acceptable degree of risk and loss.
 
I deleted my post, well spotted - thanks for the answer but you can only test something if you actually do it - I can sit here saying should have done this all day and count the pips I should have made.

I know it has only been just over 6 months in your trading career so far and you have without doubt got a long way to go. Studying TA as a business tool will certainly set you in good stead but when you look back over 5 years of trading activity, you will see economical movements and factors would have made you a much easier and arguably larger pot of cash.

JK
 
Last edited:
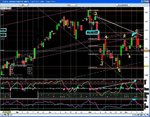
Result of the Nasdaq Comp divergence setup

On 3 December 2007 I wrote "Risks are in the 2630 relatively minor RBS level and holding as support and that the signal is at the bottom of the SBR pivot zone of 2698-2720".

Funnily enough this (and more) happened.

The reversal came:
At the higher (magical?!) 61.8% fib retrace
In the higher RBS zone of 2720-2747.
At C of an ABC correction of the prior 12345 fall.
At an extreme reading of above 100 in the Bollinger Band oscillator
Two successive small candles (ie lack of buying power)

In terms of position management, there was an opportunity of taking (partial) profits near B and/or of moving the stop to breakeven from the high of A.

Yes, this is more evidence that short signals at the base of a clear SBR zone (and vice versa) leads to, at best, small wins and more likely your stop loss being hit. So, I won't bother anymore with these marginal setups at the wrong side of a S/R zone! :LOL:

Trader_Dante makes a very important point (see #1012) in his excellent thread of taking only the best setups.
http://www.trade2win.com/boards/first-steps/26947-making-money-trading-102.html
 

Attachments

  • Nas Comp 141207 daily.JPG
    Nas Comp 141207 daily.JPG
    262.4 KB · Views: 612
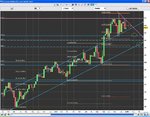
Symmetrical Triangle in IG Group plc

Weekly Chart showing a clear trend channel and symmetrical triangle formation. Also including Fibonacci retracement of current and last two swings.

Daily chart showing MA's, BB's on chart. BBO, ADX and LinReg of ADX as indicators.

Circles represent projected scenarios around key S/R pivots, fibonacci and the trend channel.

If bear market then unlikely to see upward breakout but probable relative outperformance via ranging. The set up is nonetheless a very interesting one.

Interims due later this month. Historic PER is 27x :eek:
 

Attachments

  • IG Group plc Weekly SR and Fibs.JPG
    IG Group plc Weekly SR and Fibs.JPG
    195.8 KB · Views: 714
  • IG Group plc daily.JPG
    IG Group plc daily.JPG
    222.2 KB · Views: 744
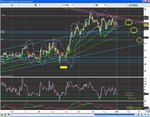
Very nice example in Kinross discovered a few moments ago :eek:

Price found support at a key support level and the 50% *fibonacci retrace of the prior major swing.
Multiple Momentum Divergence on two SMI indicators at different period settings.

*strangely the fibs worked very well using the open of the pinbar rather than the low.
 

Attachments

  • Kinross 040108 daily.JPG
    Kinross 040108 daily.JPG
    272.2 KB · Views: 572
Top