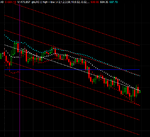
I use it primarily on minute eMini charts such as the @ER2.D. I have attached a screenshot of the indicator applied to a 5 minute @ER2.D chart. This indicator is a dynamically changing linear regression channel system. It has three bands above and three bands below the mean for different standard deviations of price. It also has a series of colored dots which will track along through the day to show you where the end points of the linear regression channel was at during the day. The blue horizontal line is the approximate VWAP . You will notice that the lines will change color based upon the lines having a slope which exceeds a threshold. This threshold can be set by the user and is a slope which is the number of points per bar rate of change. The indicator will use a set number of bars of history as it gets started in the day until it builds up some history for the current day and then it will transfer its calculations to being only for those of the current day and then the lengths for the calculations will expand as the day adds on more bars. There is a vertical magenta colored line which is the line of demarcation where this occurs. Taking this indicator and overlaying it on the standard floor trader pivots and then sitting back and observing for a while will be helpful. It is a money maker if you learn how to use it right. I will leave that part up to you.
Attachments
Last edited:

