timaru69 said:
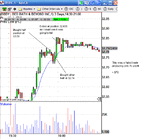
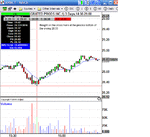
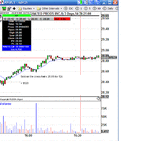
TIMSK have included volume for you. The bars are 1 min
Hi timaru69,
Thanks for the chart and the inclusion of volume. I am NOT a pundit on the price / volume (P/V) relationship - far from it. That said, if there is anything to be gleaned from the inclusion of volume, it ought to apply to most - if not all - charts. With that in mind, yours is as good a starting point as any. My (very) simplistic approach is to look for the obvious. To me, the obvious falls into three categories:
1. Unusually high volume.
2. Unusually low volume.
3. Extended periods of 'average' volume where not much appears to be happening.
Having identified these three obvious areas, I then look to see how price corresponds to the volume. For me, drawing conclusions from the relationship between the two remains more of an art than a science. Consequently,it is not easy to pass on to others. Sorry!
The first large volume bar accompanies the candle
prior to your long entry at $33.66. (You exited the trade 7 minutes or so later at $33.56 - the red line) The interesting point to note here is that the candle that corresponds to the high volume isn't quite a doji, nonetheless, the open and close are fairly close together. Also, the range of the candle is not that remarkable which, broadly speaking, can lead one to conclude that there is a balance between buyers and sellers
mas o menos. So, your long trade on the breach of this candle was relatively high risk from my perspective. I say 'my perspective', because I've no idea what lengths you've gone to in order to examine the probability of a favourable outcome from this particular setup. Hopefully, you are aware of the risks and, more importantly, the likelihood of a profitable trade. Anyway, the point is that the price action and accompanying volume on the candle prior to your entry would not have filled me with much confidence, had I been in your shoes. I know, all this is easy to say in hindsight. timaru - I must emphasise - I am NOT in any way criticising your trade!
Your second long entry at $33.71 is following two almost identical red (bear) candles, the second of which has increased volume. The probability of success is increased here for two reasons - well, three, actually. Most notably, with the benefit of hindsight, I can see that it was successful! :cheesy:
Okay - seriously - you have the higher low from the red stop line shown on your chart at $33.56. The immediate short term trend is up and the higher low is classic T.A. suggesting that the current trend remains in tact and that higher prices are probable in the immediate future. Coupled with this, is that volume has increased - albeit marginally - from your earlier exit candle at $33.56. Although the volume has gone up, price has remained static. Here we have increased activity indicated by volume. However, there is no net result, indicated by a strong movement in price. Not YET, that is!!! For me, personally, you went long one candle too soon. The candle after your entry is the one I'd be looking for in this trade. It clearly shows that buying pressure outweighs selling pressure and that, for the time being at least - the bulls have the upper hand. As a small aside, had you waited, you could have got a marginally better entry on the breach of this candle at around $33.68. Additionally, for those that are wedded to their moving averages, your long term average (blue line) is now flat, whereas, it was still descending at the time of your first trade.
The price break out above $33.70 is accompanied by huge volume. Interestingly, volume drops off noticeably after this and yet, price advances with gusto. There's a little consolidation area just below the $33.90 mark, following which volume drops off sharply as price approaches the round number at $44.00. Your exit is as close to perfection as one could wish for. I take my hat off to you, sir! I don't know whether or not you allowed volume to influence your decision but, looking at the chart, it nonetheless confirmed the decision you took to exit the trade. I should add, that I believe that price can advance on declining volume and vice versa. Unfortunately, there is no simple formula of 'big volume = price advance' or, conversely, 'declining volume = price slump', etc. If only it were that easy!
Anyway, thereafter, the price drops back down to your red exit line on your first trade at $33.56 where, clearly, if finds support. There is an unimpressive spike in volume just after 8.00 o'clock mark at 20.00hrs which goes nowhere. More importantly for prospective or existing bulls is the response by price to this half hearted effort. The bears fail to capitalise on their opportunity to flood the market with supply in order to force price below your red line. To me, this suggests that the pro's have got their fill of this stock and are not interested in seeing the price drop any further for them to accumulate more shares. No, they have their fill and are waiting to sell into a price advance for a profit. Their patience is rewarded following what amounts to a triple bottom and, finally, increased volume accompanied by an upward surge in price after 20.30. Suffice to say, if you had drawn your support line at the time of your very first trade, it would have proved very useful for subsequent trades later in the day. Your red support line, with accompanying price and volume, provides many useful insights into the psychology of the traders buying and selling this stock. Moreover, potentially it helps those that are alert, astute and attuned to the P/V dynamic to turn a profit. I readily admit that all this conjecture is relatively easy with the benefit of hindsight and that to do it in real time is an altogether different ball game!
Just my 2p worth,
Tim.


