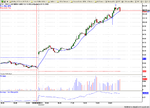
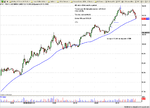
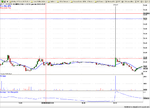
Evening trading US shares

Hi Andrew

I don't know how you faired during the evening but I found it very difficult to pick anything up that had momentum on the breakout, the QQQQ and SPY didn't seem to do much.

ANGO broke at about 19:30 but I missed the momentum that started before the break of the low, as soon as it broke it fizzled out.

Hi Pssonice

I don't understand the contents of your post in context within day trading environment. Can you elaborate please. How can intraday volumes not have any value intraday if your timespan for trading is intraday?

Regards
Steve
 
pssonice said:
intraday volumes dont have any value. from the daily volume u should have enter the market at the beginning of the year.
So far so good.

But, u didnt catch the meaning of the fibonacci number. Because of this u wont succeed in the future as well. I cant explain everything in detail. check out at google "the meaning of ... "

Hi Pssonice

The I fibs I use as a guide rather than a hard and fast method of entering trades , the stock was ADM which is what I assume you meant as opposed to AMD

Thanks

Andrew
 
the question isnt how ! the question might be "when"

if u have read my detailed explanation across the board u will recognize my thesis :

1.) the the development in price is a kind of language
2.) volume is rising during the day is an indicator that the closing volume is of interest.

if u r losing money during the day u didnt get issue 1.) or u are trading based on volume.

the most important item is the understanding of fibonacci numbers and
how to implement these number to increase your profit

"How can intraday volumes not have any value intraday if your timespan for trading is intraday?"
 
Last edited:
lloydsc said:
Hi Andrew

I don't know how you faired during the evening but I found it very difficult to pick anything up that had momentum on the breakout, the QQQQ and SPY didn't seem to do much.

ANGO broke at about 19:30 but I missed the momentum that started before the break of the low, as soon as it broke it fizzled out.

Hi Pssonice

I don't understand the contents of your post in context within day trading environment. Can you elaborate please. How can intraday volumes not have any value intraday if your timespan for trading is intraday?

Regards
Steve
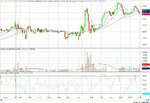

Hi Lloyd SC

Nothing realy jumped out at me as a good evening trade but I had to leave the screen around 8pm. NDE had a good late run.

The market seems to be making a lot of the move at the open then going sideways more often than not lately.

Perhaps the more experienced traders may be able to offer some insight as to why this is, it would appear to me that there is a bit of fear and uncertaintity about .

Cheers

Andrew
 
check out at google "the meaning of ..

Hi pssonice

Sorry being a bit dense here

The meaning of ....................???

Fibonacci ?
Volume and fibonacci ??
life ???

Perhaps you could pm if you have a specific website in mind as putting "the meaning of fibonacci" into Google comes back with over 529000 hits.

Cheers
 
absolutely, "Sorry being a bit dense here" that s what u r

read it severall times and carefully. it is your stairway to traders heaven if u get it

http://www.tic2tic.com/methodology.html

Key Concepts

There are three key concepts underlying our trading methodology


Price-Action: The first is that we use price-action, not indicators. Think of it this way: price-action is the most reliable real-time
indicator you could possibly have. If you know how to read price-action, you can analytically place high probability trades.

Confluence: The second is that we look for a confluence of price patterns (listed on the left) that coincide at the same price point.
The higher the confluence, the greater the probability that the price point is a volatility point off which the market will react. With
price-action in agreement, a confluence of 2 is a minimum, 3 is usually a 'must take' trade, 4 or more quite often is a gift from the
heavens. Click on each price pattern to see a simple explanation of the pattern.

Precision Entry: The third is that our trade setups define precision entry points, where the trade has a high probability of success
AND the risk is controlled, limited to failure of the pattern we are trading.
 
pssonice,
This is one of the few threads on t2w which have not been polluted by rudeness and aggression.
If you cannot behave decently and reasonably, then take your attitude someplace else, not here.
 
timsk said:
Hi Frank,
Might I enquire how you apply this to day / evening trading? That is to say, can you give an example of how volume above or below the 30 day M.A. might affect your decision making process? This isn't a challenge by the way, it's a genuine enquiry as to how you use a M.A. applied to volume.
Cheers,
Tim.
P.S. If you're feeling suitably disposed, I think I can speak for most on this thread when I say that an example illustrated by a chart would be especially appreciated. Thanks!


Hi Tim,

I use the Volume MA as one of my filters. Volume represents 'interest' in the stock which provides us with the violatility, and then momentum, hopefully.

So, with the Volume MA, I get a relative measure versus the previous 30 (or whatever number of days you care to choose). I personally will not enter a trade until I see a strong volume versus the 30 day average.

Below is an example of VIP. You can see it's strong volume versus the prior day and it's average. It's Volume at the start was an indication for me.

Hope this is what you were asking for.

Cheers,
Frank.
 

Attachments

  • VIP.jpg
    VIP.jpg
    181.7 KB · Views: 241
Mr. Charts said:
pssonice,
This is one of the few threads on t2w which have not been polluted by rudeness and aggression.
If you cannot behave decently and reasonably, then take your attitude someplace else, not here.


Sorry I was not been about earlier to do my job, but thank you Mr C for the good moderating 🙂

I have cleared a few posts and fully concur with Mr C's remarks - pssonice please take note. Thank you

jon
 
Good stuff thanks, barjon.

Re- false breakouts.
I just went long X ( US Steel Corp) as it approached its high and although it broke out, it then failed.
Nevertheless, I still took 40c out of it when it failed to follow through. This was clear on the level 2 screen.
If something is not doing what it "should" do, get out, preferably before it even gets back to break even.
I've got the chart image and will post it when I get some time.
Richard. .
 
Good stuff Richard, just took 47 cents on STLD and 32 on ANF.
Going to have a cup of tea now and not give back those profits.
 
;-))))
Also got STLD and ANF ! - no brainers from where they were in falling market with level 2 behaviour confirming, weren't they? ;-)
Coffee for me
Take care,
Richard
 
Mr. Charts said:
;-))))
Also got STLD and ANF ! - no brainers from where they were in falling market with level 2 behaviour confirming, weren't they? ;-)
Coffee for me
Take care,
Richard

Absolutely Richard, high probability setups are the name of the game. 😆
 
Hi All

Breakout trade from last night PLCM - out too early as it ran to the whole number.

I appreciate that this may not have been shortable etc. however any constructive comments are most welcome.

Thanks
Steve
 

Attachments

lloydsc said:
Hi All

Breakout trade from last night PLCM - out too early as it ran to the whole number.

I appreciate that this may not have been shortable etc. however any constructive comments are most welcome.

Thanks
Steve

Hi Steve

Nice trade, missed it myself. I believe that the stock is on the short list.

Easy to say that you got out early in hindsight, I tend to trail the stop behind the last 1 min candle and as soon as it breaks it get out. as I used to get scared out too easily on any sign of perceived strength on Level II only to see the run continue.

Here is my evening trade, missed the run to $100 earlier in the day but caught a chunk as it ran to almost $102.

Was targeting 101.95 to 102 as exit but fell off 101.94 so fast only managed exit fill at 101.69, still happy with trade though.

Cheers

Andrew
 

Attachments

  • 29 March PBR 5 Min.png
    29 March PBR 5 Min.png
    86.8 KB · Views: 250
  • 29 March PBR 1 Min.png
    29 March PBR 1 Min.png
    86.5 KB · Views: 221
Hi Andrew

The futures turning will have added to the momentum of this one. It must have been moving really fast for you to get a fill at that price.
Still at the end of the day +0.61 is all that matters and the learning process has been enhanced.
Well done.

Regards
Steve
 
lloydsc said:
Hi Andrew

The futures turning will have added to the momentum of this one. It must have been moving really fast for you to get a fill at that price.
Still at the end of the day +0.61 is all that matters and the learning process has been enhanced.
Well done.

Regards
Steve

Hi Steve

Yes the Level II went beserk, hit the order button and it sat for about 2 seconds before fill which itself was a bit annoying but as I say still happy with my trade management.

This stock was the only one that I could see that had been in an uptrend all day so I thought that 102 was on as a reasonable target.

That's something that charts don't show you is the action that goes into making up a price bar.

Cheers
 
Question time

Hi all

Quick question

INFY, any ideas what happened ?
 

Attachments

  • INFY Bump.png
    INFY Bump.png
    78.4 KB · Views: 224
Back
Top