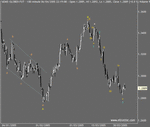
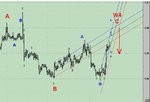
EUR/USD & DX EW labeled

Trdr

Well-known member
Messages
461
Likes
22
EUR/USD Weekly
3 scenarios:
1: ABC: doing A, takes 2-3 months to complete C
2: Reversal formation: bottoms next 2 weeks, rallies to previous H forming last leg of ‘W', Major top, Bear market follows
3: W4/5 bottoms next 2 weeks, W4 ABC completes, rallies to new W5H — see chart.

DX Weekly
Basically the eurusd chart inverted.
 

Attachments

  • ewk.jpg
    ewk.jpg
    91.6 KB · Views: 473
  • $wk.jpg
    $wk.jpg
    90.9 KB · Views: 413
Ulysses, nice site you have, what program did you use to design it, and what charting program are you using ?

Ketchup, that's some wicked EW labeling on your chart, is it a MetaTrader plugin ?

The chart indicates what I consider the 'true' W3 top followed by an AB Reversal.
My scenario has C dropping to just below the 10/22-25/04 gap, 'closing' it, basing then going up from the 1.26 area. I think 1.22/20 is just too low.
 

Attachments

  • pitch.jpg
    pitch.jpg
    101.8 KB · Views: 399
eurusd 60min via Advanced Get plus ABs.
 

Attachments

  • ag e 60.jpg
    ag e 60.jpg
    60.8 KB · Views: 440
Gaps don't appear very often in fx pairs, at least not in the eurusd, and while they aren't of much notice in the scheme of trading, the 10/22-25/04 gap is one that appears to have 'extended it's presence'.
Fibo fan applied from 10/22/04.
 

Attachments

  • e gap.jpg
    e gap.jpg
    81.2 KB · Views: 383
Question is, will the price continue to hold above the gap.


Trying a BC using L to L since the price is Correcting — down trend.
Started with the first down bar from the HH - 12/31/04, then a BC out to 28.

Weekly: from week of Feb 11/05 L, next week will be BC 14.
Start wk 3/18/05 H BC 1, wk 4/15/05 is a double BC — down and up, and would make the period ending wk May 16/05 BC 11.
Look at the Weekly as a Line chart and the formation is a lot clearer.
 
Last edited:
Fibos sometimes use H to L, or may use HC to L, or HH to LC etc, the 'proof' or confirmation when using fibos is that a significant level is 'hit' accurately, most often by the Close. If a significant level isn't hit then the fibo has been applied inaccurately and needs to be adjusted or re-applied; this isn't second guessing or after-the-fact re-application, just the nature of price movement; sometimes it'll be found that a HC fibo and H fibo etc will accomodate the Close hit and the H will accomodate the L of the target level.

Generally 2 fibos can be applied, the Up or Down projection fibo and an Up or Down Retracement fibo often providing confirmation of target being hit when significant levels are hit simultaneously.
 
Last edited:
Newbie sharing

Hi, I'm still learning the EWT here's a chart on 1hr EUR/USD. I'm currently using the automatic labelling as I'm still learning it from books. Pardon my laziness. Euro is now moving upwards in wave iii?

I'm reading at elliotwaveinternation on the wave theory and with reference from Elwave's manual on the wave formation, I have the book Applying Elliott Wave Theory Profitably by Steven W. Poser but it was too complicated for a newbie so I'm now starting with Pretcher's online guide which made things a little simple for me before I move on to the book that is 100% proof (vodka's terms) hopr the charts could tell you something too.
 

Attachments

  • euro_w3.JPG
    euro_w3.JPG
    96.4 KB · Views: 393
  • euro1hr.JPG
    euro1hr.JPG
    73 KB · Views: 331
Last edited:
Hi Davn, personally prefer Advanced Get.

Have you read: ‘Elliott Wave Principle : Key to Market Behavior' by Frost and Prechter.
 

Attachments

  • ag 60.jpg
    ag 60.jpg
    101 KB · Views: 315
DX Monthly suggesting a completion of the ABC W4 and Reversal into W5 by next month.

.
 
Last edited:
EURUSD W & M

There's a lot of lines on the Weekly because of using several Gann Squares, generally the user is able to see what matters, hopefully the chart isn't too confusing to be instructive.
Used only as a 'trendline matrix' the Gann Square can be very accurate.
 
Last edited:
Ketchup, did you see Paul McCartney when he played in Red Square ?

I'd wondered whether the H indicated by the Blue arrow was the 'technical H' and next HH the B of an AB reversal. A similar reversal formation is seen at the previous 1.29 area .

These Reversals are always problematic, will they appear ? will they make a HH/LL ? where does the Bar Count end ? where does the new BC begin ? if the price hit the 'significant' fibo level has it topped/bottomed ? which is the correct point to use to draw a Retracement fibo from ? (Red arrow indicates the H used to begin the Red Retracement fibo ) is the formation a Wave count or a reversal formation ? using smaller and higher timeframes helps.

The second chart is AG with Gann Box and still holding to the idea a W4 ABC Correction is continuing before the Euro rallies to a new H.
 
Last edited:
Hello Ketchup, basically yes.

The Bar Counts I have on both the eurusd and $ have a significant count on Week of July 15.

I'm still looking at the $ formation as the completion of C of the W4 ABC, if so then there'll obviously be a W5 down.

$ rally to 90+ area (possible 92 area matching the A leg), eurusd decline to 1.19+ area.
 
The Blue and Red fibos were changed from the previous chart showing their coincidence of the Close price hitting the 61.8 / 161.8% levels at the week July 5 BC.

Some people are looking for the euro to drop to 1.12, or 1.09, or 1.05 !!!

The Dec/March Weekly top formation was a 'weak' AB Reversal; this week completing W4, White fibo and others for W5 Price target plus BC targets.
 
Last edited:
Gann Boxes in Advanced GET plus a good hit with the Ellipse.
2H/120min chart.
 

Attachments

  • gaps.jpg
    gaps.jpg
    137.8 KB · Views: 222
Yellow horizontals indicate gaps.

Current consensus is the US Fed will raise the FFR by 0.25% irrespective of New Orleans.

White Retracement fibo: the March 11 H was used for the fibo because it's this measure that the price hits at the 23.6% and 32.6% levels, confirming for me the fibo is correct. Using other Highs produces levels the price doesn't hit. What's uncertain is the last H stopping in no-man's land. That H and the previous form a W that could be a Reversal formation suggesting the price won't go higher but continue to decline.

50% line is the proposed H target.
 
Last edited:
My feeling is the 04-05 H/L/H on the Weekly chart below is an EW 'AB Reversal' formation, as such the Correction didn't begin until after the March/05 H; too small to be an AB of an ABC, the formation could be W1-2 of a W3A/W5A formation of an ABC.

If the 04 H is major W3, then an ABC Correction should occur with a new H above 1.26 beginning this week and completing WB — otherwise it's an extremely small WB, WC to 1.16 or even 1.12, followed by new highs above the previous H of 1.3668.

Another 'could be' is the Jul-Sep formation is completing a Base, preceeding a new WB in which case the Jul 1.1865 low may not be breached.

If the 04 H is major W5, then an ABC Correction should occur; WA has completed W4 and is doing W5 — to a low of 1.16 or even 1.12, WB back up to 1.20s (?), and WC down to 1.05-1.00 — par.

A last alternate is the Jan/Feb 04 H was major W3 and currently WC of the ABC is completing or has completed.
 
Last edited:
Top