Elliott Wave Forex Scalping

Here is the 5 minute chart with the modified stochastic. There is a pin on the bottom candle and it has already made a new high, so I'm in long.

If it holds there is a reverse head and shoulders I have drawn a blue box around...
 

Attachments

  • 01_06_2011_5_minute_2.PNG
    01_06_2011_5_minute_2.PNG
    30.5 KB · Views: 174
And last but not least the Ichimoku has no upward confirmation yet, but the candles are through the cloud for the moment and the Chinkou span (the purple line) is heading up. If the Chinkou breaks through the cloud to the upside then it will go for a while. All three methods are giving clues that this down move is probably over, but not confirmation yet.

Here is some confirmation from the Ichimoku.....The Chinkou span has busted through the cloud to the upside and there have been multiple candle closes above the cloud. It's still early in the process but confirmation is happening at the moment
 

Attachments

  • 01_06_2011_5_minute_Ichi_1.PNG
    01_06_2011_5_minute_Ichi_1.PNG
    31.2 KB · Views: 159
Here is some confirmation from the Ichimoku.....The Chinkou span has busted through the cloud to the upside and there have been multiple candle closes above the cloud. It's still early in the process but confirmation is happening at the moment

The Chinkou is back down into the cloud for the moment, but I think we are on the way back up.
 

Attachments

  • 01_06_2011_5_minute_Ichi_2.PNG
    01_06_2011_5_minute_Ichi_2.PNG
    31.7 KB · Views: 197
From an Elliott Wave standpoint this looks like a leading diagonal right now...
 

Attachments

  • 01_06_2011_5_minute_Pitchfork_2.PNG
    01_06_2011_5_minute_Pitchfork_2.PNG
    24.5 KB · Views: 176
So far the Euro is staying above the cloud and bouncing off of it........
 

Attachments

  • 01_06_2011_5_minute_Ichi_3.PNG
    01_06_2011_5_minute_Ichi_3.PNG
    27.8 KB · Views: 151
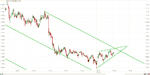
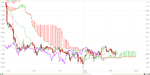
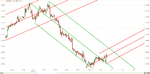
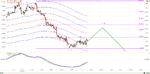
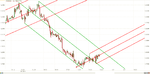
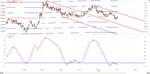
This is very interesting because my last post last night said that there was a sell signal on the fractal indicator on the five minute chart and I saw my post here this afternoon when I came home from work, but now this post is gone. This is the first time this has happened here, but anyway if anyone reads this thread then you saw it here too. Moving on,,,,,,,,,,,,I was wrong about the Euro making a bottom last night and here is my updated Elliott Wave chart........ I believe that we are in a wave 5 now and it should end Sunday night EST,,,,,,,,,, probably on a gap down. Now with that being said Elliott Wave does allow for an extended wave down. I will say that I bought after the drop today after the U.S. announcements because I thought that was the end of the down and right now I am underwater on this trade. But I do believe that we are close to ending a wave 1 on a larger scale and after that then we will see a 61.8% or larger retracement for wave 2..........My position is small, so I won't give up on my long for several hundred more pips.......
 

Attachments

  • 01_07_2011_5_minute.PNG
    01_07_2011_5_minute.PNG
    32.6 KB · Views: 180
Moving on,,,,,,,,,,,,I was wrong about the Euro making a bottom last night and here is my updated Elliott Wave chart........ I believe that we are in a wave 5 now and it should end Sunday night EST,,,,,,,,,, probably on a gap down. Now with that being said Elliott Wave does allow for an extended wave down. I will say that I bought after the drop today after the U.S. announcements because I thought that was the end of the down and right now I am underwater on this trade. But I do believe that we are close to ending a wave 1 on a larger scale and after that then we will see a 61.8% or larger retracement for wave 2..........My position is small, so I won't give up on my long for several hundred more pips.......[/QUOTE]

There was the down gap like I thought there would be to day and this could be the end of wave five which completes a wave 1 on a larger scale. Wave 3 ended at 1.2903 and this pair has already moved up to 1.2906 tonight, so this is a good indication that wave 5 has ended where I have marked it. This is still possibly part of wave 4, but it isgrowing less likely as time goes on.
 

Attachments

  • 01_09_2011_5_minute.PNG
    01_09_2011_5_minute.PNG
    30.2 KB · Views: 174
Here is the Ichimoku 5 minute. The candles have gone up above the cloud...........the cloud has turned green which means it is going up and the Chinkou span has crossed above the candles and the cloud. These are all three bullish signals.........
 

Attachments

  • 01_09_2011_5_minute_Ichi.PNG
    01_09_2011_5_minute_Ichi.PNG
    31.5 KB · Views: 178
The Euro is looking down for a few hours and then much higher for the medium term................I know this is a scalping thread, but I want everyone to make lots of pips. (Including me)
 
Here is the Ichimoku 5 minute. The candles have gone up above the cloud...........the cloud has turned green which means it is going up and the Chinkou span has crossed above the candles and the cloud. These are all three bullish signals.........

The bullish signals on the Ichimoku last night were correct.
 

Attachments

  • 01_10_2011_5_minute_Ichi.PNG
    01_10_2011_5_minute_Ichi.PNG
    30.6 KB · Views: 166
I don't consider this a scalping chart, but it is good to look at the bigger picture and know what the dominant trend is before going to the smaller charts and scalp. Here is my 1 hour pitchfork chart. I suppose that odds are good for the Euro to at least go test the green line and with Elliott Wave added to that it should go beyond that and make a larger retracement. With that being said I think the move down in side the green fork was a complete wave one down and it is in wave 2 going up right now. If this in fact the case after wave 2 completes then the Euro will start wave 3 down and based on Elliott Wave Theory this will probably be a very strong move down.
 

Attachments

  • 01_11_2011_1_Hour_Pitchfork.PNG
    01_11_2011_1_Hour_Pitchfork.PNG
    32 KB · Views: 328
Here is my other 1 hour chart with the modified stochastic/fractal, and a wave count and fib and percent channel. All of these indicators are pointing to the Euro going up some more.
 

Attachments

  • 01_11_2011_1_Hour.PNG
    01_11_2011_1_Hour.PNG
    36 KB · Views: 212
I'm going to use a TRIX indicator for the next several posts because I think this is a good indicator that I have used in the past and I want you to see how it works. I have 2 TRIX indicators set up below the candle stick chart. The top one is set up on the 8 MA period and the bottom is set up using the 21 MA. I like to use 2 ma periods because this gives different clues to what a currency pair is going to do. I will not go into the lengthy explanation as to what makes this indicator work, because anyone can find that info in many places online.
 

Attachments

  • 01_11_2011_1_Min_TRIX.PNG
    01_11_2011_1_Min_TRIX.PNG
    26.8 KB · Views: 322
I don't consider this a scalping chart, but it is good to look at the bigger picture and know what the dominant trend is before going to the smaller charts and scalp. Here is my 1 hour pitchfork chart. I suppose that odds are good for the Euro to at least go test the green line and with Elliott Wave added to that it should go beyond that and make a larger retracement. With that being said I think the move down in side the green fork was a complete wave one down and it is in wave 2 going up right now. If this in fact the case after wave 2 completes then the Euro will start wave 3 down and based on Elliott Wave Theory this will probably be a very strong move down.

The Euro is still heading towards the green line and has stayed in the smaller red fork all day.
 

Attachments

  • 01_11_2011_1_Hour_Pitchfork_1.PNG
    01_11_2011_1_Hour_Pitchfork_1.PNG
    31.6 KB · Views: 212
Here is the current five minute Euro chart withe a regular stochastic and fractal applied on top. I know in my earlier posts I have been using a modified stochastic, but I have been testing the regular stochastic set on 34,13 and 8 periods and it has been performing a little better. Anyway look at the diagonal forming in the stochastic and the candles. They are similar. Also look how good the fractal is working on the stochastic. It's very simple........sell when you get a red fractal on top of the stochastic and buy when you get a green fractal under the stochastic. If you can set this up on your charting software then you will get some very good signals. Now just let me say that if you use this on other time frames and other currency pairs then it will work fine, but the time periods of the stochastic will need adjusting and it is less reliable with some pairs than others. Also I use this in conjuction with my own Elliott Wave Analysis. As always, the more you learn and can use for confirmation then the better trader you will be.
 

Attachments

  • 01_11_2011_5_minute.PNG
    01_11_2011_5_minute.PNG
    22.3 KB · Views: 207
Also if anyone here doesn't know then triangles are almost always the next to the last formation before a reversal. That means one more push to new highs and then a nice down move.
 
Here is something I don't think I have ever seen in 5 years of trading................A buy fractal in between the 2 stochastic lines........
 

Attachments

  • 01_11_2011_5_minute_1.PNG
    01_11_2011_5_minute_1.PNG
    23.5 KB · Views: 417
The Euro is still heading towards the green line and has stayed in the smaller red fork all day.

Now is decision time for the Euro. It is right against the green line............and now we wait to see........
 

Attachments

  • 01_11_2011_1_Hour_Pitchfork_2.PNG
    01_11_2011_1_Hour_Pitchfork_2.PNG
    31.7 KB · Views: 532
I trade the USD_JPY and The EUR_USD and no other pairs at the present time. Here is a nice jpy fractal sell when you would think that the dollar is heading up before that... After this push down then I am looking to buy.........BTW, I am still counting Elliott Waves here as well and I was looking for another move down in a wave "C". That is why I didn't buy on the first buy fractal.........If you are willing to put in the work then I think what I am posting here is a great system.
 

Attachments

  • USD_JPY_01_11_2011_5_minute.PNG
    USD_JPY_01_11_2011_5_minute.PNG
    25.6 KB · Views: 200
I have added a pitchfork and when it gets to the M line (median line) then I am buying
 

Attachments

  • USD_JPY_01_11_2011_5_minute_2.PNG
    USD_JPY_01_11_2011_5_minute_2.PNG
    30.8 KB · Views: 225
Top