Elliott Wave EUR/USD

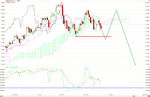
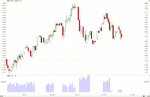
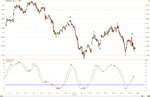
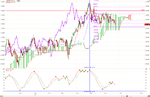
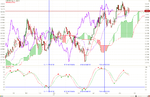
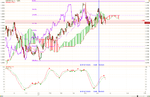
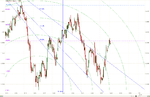
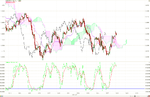
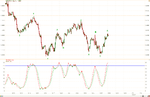
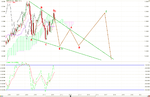
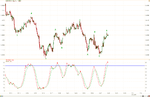
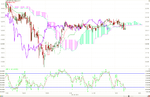
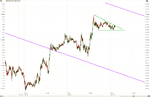
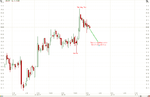
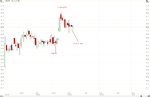
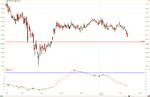
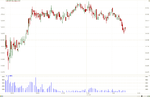
Here are two daily charts and 1 hourly chart for the Euro. The ichimoku chart shows that the Euro still has some more down potential into the 1.4000 - 1.3900 range, but after that it will probably go back up into the 1.4500 -1.4700 area. Also I am including a daily chart with volume under it. The volume for this last move down has been very low, so that means not much conviction here to the downside, and that bolsters my opinion of a move back up. Also the move down on the daily chart is in a 3 wave pattern and that is corrective instead of impulsive.........so in my opinion this is probably unfolding as a flat on the daily chart...........
 

Attachments

  • EUR_USD_06_24_Day_Ichi.png
    EUR_USD_06_24_Day_Ichi.png
    47.6 KB · Views: 127
  • EUR_USD_06_24_Day_Volume.png
    EUR_USD_06_24_Day_Volume.png
    30.1 KB · Views: 133
  • EUR_USD_06_24_Hour_Stochastic.png
    EUR_USD_06_24_Hour_Stochastic.png
    44.1 KB · Views: 139
World of pain for me, i changed my position to a larger one and put the stop at 14300

I would of seen it return to there but i was asleep so i got stopped out and it only reached 14306
And then continued on its way down -.- how frustrating, i should of left my position as it 1st was
 
World of pain for me, i changed my position to a larger one and put the stop at 14300

I would of seen it return to there but i was asleep so i got stopped out and it only reached 14306
And then continued on its way down -.- how frustrating, i should of left my position as it 1st was

I am really sorry to hear that Doom. Are you still building your trading system??????? Once you understand the markets, (which I think you are doing well at that ) you should begin to build a trading system.............That will entail using what you want to signal a buy or sell, and you should use it on 3 different time frames before taking a trade............

Good Trading Brother,
JahDave
 
I don't like the look of this, because the EW patterns are showing more highs after the lows that are coming up............Here are the daily Kiwi, Aussie and the Euro charts. The moves down on all three are in threes , and that is corrective................This means more USD weakness.............and I don't like it..............but that is what the charts are saying and I always believe the chart patterns........

Good Trading,
JahDave
 

Attachments

  • AUD_USD_06_26_2011_Ichi_Day.png
    AUD_USD_06_26_2011_Ichi_Day.png
    51.1 KB · Views: 137
  • NZD_USD_06_26_2011_Ichi_Day.png
    NZD_USD_06_26_2011_Ichi_Day.png
    57.6 KB · Views: 124
  • EUR_USD_06_26_Day_Ichi.png
    EUR_USD_06_26_Day_Ichi.png
    59.5 KB · Views: 126
Based on the daily waves of the Euro, I will be buying at 1.3675.............
 
I am really sorry to hear that Doom. Are you still building your trading system??????? Once you understand the markets, (which I think you are doing well at that ) you should begin to build a trading system.............That will entail using what you want to signal a buy or sell, and you should use it on 3 different time frames before taking a trade............

Good Trading Brother,
JahDave

Yeah im still building my trading system, i think mainly i may excel at intraday as longer trades don't seem to suit me as well... but i'd love to get the hang of longer trades, i struggle not to intervene when something like a double bottom appears for example... getting much better though
 
Based on the daily waves of the Euro, I will be buying at 1.3675.............

Dave. What do you think of USDCHF? I've heard a few things about EURCHF bottoming out from a few good traders as well. With EURUSD potentially topping out. USDCHF might be the big mover?
 
Dave. What do you think of USDCHF? I've heard a few things about EURCHF bottoming out from a few good traders as well. With EURUSD potentially topping out. USDCHF might be the big mover?

Hi Brettus,

I do track the USD_CHF, but I have not traded it for a while because I believe it will bottom out long term between .8300 and .8000. After I see an impulse move up on even the hourly chart then I will be looking to get in long on the pullback. I think this pair has the potential to go up to the 1.40 area in the next several years. Also I think the USD_JPY has some huge potential as well and I am currently long there for the long term with a small position.

Good Trading,
Dave
 
My analysis is that the Euro is starting down in a "B" wave before it makes the final "C" wave up to the 1.4500 area. After that then we should see a good push down below 1.3900. I will have to watch wave patterns back down to see if it is impulsive or corrective on a bigger scale, but if it is impulsive down it will make it down to around 1.2000.
 

Attachments

  • EUR_USD_06_27_Fibo_Hour.png
    EUR_USD_06_27_Fibo_Hour.png
    50 KB · Views: 124
  • EUR_USD_06_27_Ichi_Hour.png
    EUR_USD_06_27_Ichi_Hour.png
    56.8 KB · Views: 139
  • EUR_USD_06_27_Stochastic_Hour.png
    EUR_USD_06_27_Stochastic_Hour.png
    41.6 KB · Views: 121
The Monthly Euro looks like a leading diagonal down...............Also I have sold here because the hourly has given a sell fractal..........
 

Attachments

  • EUR_USD_06_27_Ichi_Month.png
    EUR_USD_06_27_Ichi_Month.png
    49.8 KB · Views: 119
  • EUR_USD_06_27_Stochastic_Hour.png
    EUR_USD_06_27_Stochastic_Hour.png
    43.2 KB · Views: 116
Hi Brettus,

I do track the USD_CHF, but I have not traded it for a while because I believe it will bottom out long term between .8300 and .8000. After I see an impulse move up on even the hourly chart then I will be looking to get in long on the pullback. I think this pair has the potential to go up to the 1.40 area in the next several years. Also I think the USD_JPY has some huge potential as well and I am currently long there for the long term with a small position.

Good Trading,
Dave

I just bought some USD_CHF at the .8280 area
 
Here are my thoughts on the Swiss Franc. I bought it today at .8281. One of my posts several weeks ago said that my target was somewhere between .83 and .80 and that fibo time was showing a major reversal at the middle of July and that was not totally reliable, so I thought it may reverse around the end of June, and I think it has. I am posting up a five minute chart of the USD_CHF that is almost looking impulsive up. I will keep watching it and will decide where it is going based on wave patterns.
 

Attachments

  • USD_CHF_06_28_2011_Ichi_5_Minute.png
    USD_CHF_06_28_2011_Ichi_5_Minute.png
    48.2 KB · Views: 112
Here is a good pitchfork setup on the 5 minute........I actually have already placed the lower line where I think it will go instead of where it is..........The reason for this is because on an Elliott wave count, then this pair should be in a "C" wave going down against the new trend, which is the last leg of wave 4 on a larger scale..............I think this pair will stay in the trendline up for a good while now.
 

Attachments

  • USD_CHF_06_28_2011_Fork_5_Minute.png
    USD_CHF_06_28_2011_Fork_5_Minute.png
    26.4 KB · Views: 109
Here comes the Euro for one last gasp up to about the 1.4400. It is in a triangle right now and by Elliott Wave standards there is always one more move in the direction of the trend after that. And after that there is usually a very decisive move in the other direction after people realize that things have changed..............I am getting ready for some really good USD strength across the board the next several days or weeks......
 

Attachments

  • EUR_USD_06_28_5_Minute.png
    EUR_USD_06_28_5_Minute.png
    32.1 KB · Views: 116
Now for the USD_JPY,,,,,,,,,I am going to post a naked chart except for candles and comments...........I love candlesticks as an indicator and use them everyday with other indicators..............Steve Nison has several great books you can buy that he wrote, and I think he is the king of western candlestick understanding...........Here goes.........
 

Attachments

  • USD_JPY_05_28_candle_hour.png
    USD_JPY_05_28_candle_hour.png
    24.7 KB · Views: 125
Next Post, and I think we know where this is going.
 

Attachments

  • USD_JPY_05_28_candle_hour_1.png
    USD_JPY_05_28_candle_hour_1.png
    21 KB · Views: 119
If the USD_CHF breaks the .8302 level then it will go lower.............I don't think it will..........but that is the test...........
 

Attachments

  • USD_CHF_06_28_2011_Ichi_5_Minute.png
    USD_CHF_06_28_2011_Ichi_5_Minute.png
    48.2 KB · Views: 98
If the USD_CHF breaks the .8302 level then it will go lower.............I don't think it will..........but that is the test...........

This is the correct chart.....
 

Attachments

  • USD_CHF_06_28_2011_5_Minute.png
    USD_CHF_06_28_2011_5_Minute.png
    29 KB · Views: 110
I think this will be a testament to Elliott Wave Theory..............If this is not, then I will still be at peace, as I know the USD_CHF is going to bottom soon........... The bottom line is that if it breaks the .8302 then it will go lower, and if it does not, then it has reversed...........
 
I think it is funny that tops and bottoms have very low volume...............People are scared........I like to jump right in and believe that i got in at the right time..............I don't like to follow,,,,,,,,,,,,,,,I like to lead.............
 

Attachments

  • USD_CHF_06_28_2011_5_Volume.png
    USD_CHF_06_28_2011_5_Volume.png
    23.1 KB · Views: 114
Top