Dr. Toad's Journey to Bankruptcy or Financial Freedom

I use MT4. I know nothing about Trade Station.
There are loads of people trying to come up with a winning system there. Mostly they produce varying degrees of losses but sooner or later one will make it. I have devised systems and got them coded up but alas not much good so far.
At the moment I am working with a developer in Russia who seems to be near.

I was recently sent an extensive list by a broker of hundreds of systems that could be leased and was shocked that all had been curve fit to past profits and when you dug in to the detail they all were so so since live and some shockingly so.

What was more surprising from a marketing point of view, was how many had recommended amounts to trade the strategies and in many cases the largest drawdowns were in excess of this amount.

Strange world out there!
 
I use MT4. I know nothing about Trade Station.
There are loads of people trying to come up with a winning system there. Mostly they produce varying degrees of losses but sooner or later one will make it. I have devised systems and got them coded up but alas not much good so far.
At the moment I am working with a developer in Russia who seems to be near.

I remember back when I was still active a year and a half ago or so you (I believe it was you) started a thread learning to code MT4 right around the time I was starting to learn EasyLanguage (TradeStation coding language). It is satisfying when you get something to work (as far as coding goes even if it is **** as far as strategy goes), but it is a bitch when you can't figure out why your code isn't doing what you think it is supposed to.

What's the reason for going the developer route rather than continuing to learn to code yourself? Although I got pretty frustrated at points along the way, I am now comfortable coding most things in EasyLanguage. There are still some more advanced things I haven't learned yet (like defining global variables to use between multiple charts), but I have found workarounds for most of this stuff so far.

Initially I was going to go the MT4 route, but when I started looking at it, it appeared to be pretty limited as far as trading stocks. I think I remember not many brokers supported it, or maybe it was just that no one used it for that so finding coding examples for stuff was hard. It seems to pretty much be used for Forex exclusively (some exceptions I'm sure but that was my impression).


I was recently sent an extensive list by a broker of hundreds of systems that could be leased and was shocked that all had been curve fit to past profits and when you dug in to the detail they all were so so since live and some shockingly so.

What was more surprising from a marketing point of view, was how many had recommended amounts to trade the strategies and in many cases the largest drawdowns were in excess of this amount.

Strange world out there!

If I were making systems to lease, I would make them so that they just maintained break even. Someone would be pretty likely to continue using a system that maintained break even, so the money from rental would keep coming in :p. Why anyone would lease/sell a successful system is beyond me...a break even one though...brilliant. That's the main reason I didn't bother much looking at systems already coded up and available.
 
Well done learning to code. I got so frustrated that I binned that idea and used a developer. The zigzags of prices on a chart seem to have baffled most systems so far but I am an optimist.
 
Without further ado...an update:


On the graph, blue is the projection, green is the theoretical results (more on that later), red is the actual results.

At first glance it appears this has blown up on me. However...this may also be simply a case of going live at the most inopportune time as well as increasing risk at the most inopportune time. The reason I think this may be the case is that the drawdown I am seeing is not outside the realm of what I saw in the forward testing of the strategy...although it is higher, it is of the same magnitude of the worst area in my forward testing once normalized for risk. I quite literally increased my risk the day before I had the biggest drops..my timing really is impeccable. C'est la vie.

Enough lamenting though. In order to try and figure out what was going on, I did forward testing on the stock selections since going live. The way I back tested and forward tested this was assuming that every valid stock was entered each day. This simply is not possible until my risk level is higher. I knew that there would be some variance between my actual results and theoretical (in on all possible) results due to this, but I was expecting the difference to be smaller than what I was seeing.


In order to try and minimize the difference between my actual results and theoretical results as far as possible, I increased the number of stocks I am allowing my system to trade each day and reduced the risk of each trade down as far as I can without the commissions becoming unreasonable. The commission for me is $0.01/share or $1.00 minimum, so I have my risk set at a level that puts me at around 50-150 shares depending on the stock. Any less than 100 and the commissions starts eating into the gains due to the minimum commission so I can't practically reduce much further per stock than I am at.

I implemented this change on 4/24 and am hoping going forward the divergence between my theoretical and actual results minimizes. When (if I ever get to) increasing my risk, I will do it by adding entries until I have maxed that out. Only then will I start increasing the risk per trade.

Although some of you may be thinking I am crazy for having any confidence in the system I am using seeing the results....


...this is why I still have confidence in it. If anyone has a fully automated strategy with a smoother growth curve than that for forward testing including commissions (absolutely no optimization on it) then...I envy you. I suppose the very nature of adding myself into the market could have changed the dynamic of the system...but really...I wasn't expecting to have any notable impact until my risk was about an order of magnitude higher than it is now.

Everything except my bank account is convinced that this system has merit. Unfortunately, at the end of the day, my bank accounts opinion is the only one that matters.

But for now...onwards with this...here's to hoping my system is just in drawdown and my theoretical and actual results start matching up.
 
Another week of testing passes and...


still looking very meh at this point. However, after doing some analysis on how my actual trades were matching up to the theoretical trades I did notice a distinct trend.


There is a clear divergence between what my theoretical results and actual results are. It is fairly slight, but definitely there and I feel pretty confident in saying now that is is more than simply not taking all the trades the system offers. Although, implementing the change to take more trades did smooth the divergence out a bit...so slight improvement on it by doing that. The divergence appears to be fairly constant, so I took this and applied it to my initial projection:


and what I am left with is a system with a very slight negative expectancy...something I am all to familiar with, and something my results seem to indicate. I do believe this system has merit though, and I have a few tricks up my sleeve to try and get my actual results matching up more closely with the theoretical results. I am currently running simulations on the same set of stocks I created my initial theoretical curve with to see how the tweak matches up. I did backtest the tweak I intend to implement while developing the system and the main reason I didn't use it is it took fewer trades than the one I have been using.

I will implement the second iteration of my system starting next week and will be tracking how my theoretical and actual trades match up...I feel like I am close, but if I can't get my actual to match closer with my theoretical then this system is doomed and I will be back to square one. Perhaps it is time to start looking at longer timeframes again. :(
 
Analysis complete on the v1.1 system and...


...not what I was expecting. The systems were essentially the same until just before I started putting myself into the equation of the v1.0 system. Impossible to say if adding myself into the equation of the v1.0 system caused the notable divergence between the two or if that is pure random coincidence. I have to believe it is the latter since the position sizes I have been testing with are a fraction of the daily volume (less than 0.025%) so should have negligible impact.

Logic tells me the v1.1 will track closer to the theoretical, the fact that it also appears to be better overall than the v1.0 is very surprising to me, but we will see how well the theoretical and actual trades track next week. Hopefully a significant improvement but I am highly skeptical.
 
Last edited:
Your analysis looks like a continuous bull market. In reality probably needs some dips ? I can't recall any continuous bull markets over years.
 
Your analysis looks like a continuous bull market. In reality probably needs some dips ? I can't recall any continuous bull markets over years.

No disagreement here. I am well aware the theoretical trades look quite spectacular. I am quite skeptical the system will perform, but the only way to check it at this point is to live test it. I have dotted my i's and crossed my t's so to speak with the theoretical. The reason I suspect it looks this way is because of the way it was designed.

The intent is for it to be a high probability system. Backtests and theoretical tests indicate I should be around the 70-75% win range. In addition to this, there is a good deal of diversification most trade day with typically between approx. 4-10 valid entries (for the v1.1, the v1.0 was more like 8-15). Finally, the positions have been sized and the catastrophe stop set at a level that the stock is very unlikely to reach (live and backtesting indicates between about 10-15% of the time).

All off these factors combined make winning days likely to occur as long as I only have 1 or 2 catastrophe stops tripped. However, having a stop tripped eats into the profits a good deal which makes for a slow steady growth curve with little drawdown as the theoretical results indicate.

The theoretical curves include expected commissions (when at full risk...during the testing phase I am at about twice it, but that has negligible impact), and slippage. It also includes every stock in the test period I have available (since I started running the stock selection scan). Quite often my actual trades are matching exactly in outcome (less the slight addition in commissions) to my theoretical, but it is the 20% or so of the time that they don't​ which causes the problem.

I have made two changes to the system from v1.0. One of which is a slightly more stringient entry criteria. Not sure that one will really help with the discrepancy, but it might. The other change is to take into account the current bid and ask for the stock and factor that into my entry price. I think this will be what helps my system match up better, since logically if my entry is in line with the current bid/ask, my trade should have little to no impact on the trades that would have occured if I did not put myself into the system. At this point the only missing piece seems to be making myself a ghost to the market since the theoretical results have kept chugging along up and to the right in both systems...one moreso than the other though.
 
The theoretical curves include expected commissions (when at full risk...during the testing phase I am at about twice it, but that has negligible impact).

Something didn't feel quite right when I typed that up...went back and checked that assumption by looking at the expected divergence due to the average "increased" commissions during testing looking at the 1.0 system:


So basically I'm not quite as far off as I thought I was. Something is still amiss in the system, but I need to make sure I am comparing apples to apples going forward, so will include the effective increased commissions cost in my comparison.
 
Short and sweet this week:

The good:


Actual trade entries/exits are now, the vast majority of the time, matching or slightly better than the theoretical entries. The one outlier is a trade that my actual system reached the target profit in and the theoretical system did not...the exception to the norm and I do not expect to occur regularly. So...problem solved.

The bad:


Still losing money. I'm all out of ideas on this one. Matching my actual to theoretical was the best I could do which I appear to now have. If I have another week of losses I am going to be seriously considering shelving this one and moving to higher timeframes/giving up for another year.
 
Sorry to stick my oar in to your thread a little late in your experiment, I have been a silent visitor over the past months though! Would you mind giving some tech background to your setup?

I.e.

Which broker(s)
What time frames do you look for signals on, and how many data points do you backtest over
What stocks/sectors/countries
What coding languages(s)
What other software are you using eg. backtesting, development, databases, etc

I'm a coder myself (I'm a **** poor trader) hence I am less interested in the specifics of your strategy's​ and more the tools and tech setup you are using.

Cheers if you're u can fill me in at all... (y)
 
Sorry to stick my oar in to your thread a little late in your experiment, I have been a silent visitor over the past months though!

No worries, it gets quite boring talking to myself. Interjections are appreciated.

Which broker(s)
What coding languages(s)
What other software are you using eg. backtesting, development, databases, etc

TradeStation is the broker I use for my automated strategy development and testing. Due to this, the coding language used is EasyLanguage. I have a subscription through them to Portfolio Maestro (as long as minimum trade criteria is met it is free...not free when I am developing and not live testing though (n) ).

The original intent of Portfolio Maestro is to allow testing of multiple strategies simultaneously on a single account to determine how good/bad they work together. What I use it for though is to test one strategy on large numbers of stocks at the same time...saves a lot of time not having to manually go through and backtest each stock individually. That said, Portfolio Maestro has a good number of nuances that make it a PITA sometimes.


What stocks/sectors/countries

All US stocks, all sectors. For pretty much any of my strategies I develop I have a baseline criteria the stock needs to meet for it to be considered trade-able.

Baseline criteria is:

- $20.00 <= Previous day close <= $200.00
- Volume for the past 5 days have been >= 500,000 each day

Those criteria are occasionally modified slightly depending on the strategy, absolute min volume I typically consider is 350,000 / day and absolute min close I typically consider is $15.00. This cuts the stock pool down from about 9,000 to about 1,000 potential.

Each system I develop has a stock ranking criteria component which then takes these 1,000 and determines which ones are the better ones to trade for the strategy. For example with the current one I am testing I have determined when my scan indicates a rank value greater than 20 it is an acceptable candidate to trade. The number with rank values greater than this varies each day but seems to typically fall between 4-30.

I then apply my strategy to each of these stocks typically the night before and just let it run the next day. My strategies always have a limiter of some variety to keep me from entering more than my risk tolerance allows, so basically the first "x" stocks that have valid entries during the day are entered. The limiter I use is generally something along the lines of "if "x" positions are open, do not enter trade". The only time I enter in a number greater than intended is when multiple entries fire off on the same bar which brings me to:

What time frames do you look for signals on

I have been trying to get something intraday to work for me...generally looking for trades to last ~ 2-4 hours. I realize this doesn't really answer your question because really what I have been trying to do is determine where a stock is unlikely to go during the day based on the recent behavior of the stock. I then use this to set my stop loss and size my position. Next I look at where it is likely to go and set my target(s) where my exit code begins (trailing stop, limit sell based on time of day/immediate price action, etc.).

So to answer your question directly, I have my strategy set to run on 15 second bars currently, and this is typically what I test all my strategies at/run them at that are similar to this one. This is not actually what I would consider the timeframe I trade though...the timeframe is more...one day. I say this because, as soon as the day opens, my strategy already has determined my entry, stop loss, and target value(s) (for this particular strategy).

Why 15 seconds? After doing some research I found that with TradeStation it will only accept new orders every 15 seconds...this may have changed since I originally looked that up. But, this interval makes it unlikely that I enter in more trades than I have my risk tolerance set at, and it also helps reduce the risk of missing trade exits.

Due to the way TradeStation code runs (executes end of each bar), any trade I take is essentially completely exposed for one bar. If I were to trade on something like a 1 hour bar, my system may completely miss my target or stop loss due to this. Setting my interval all the way down to 15 seconds makes this a non-issue. I could set it at tick level but as I said, I believe my broker would just reject my order updates until the minimum time passes, and I honestly don't think my systems would run any better, so why bother?

I have looked at other specific time intervals with other strategies that consider recent price action for signals...generally ranging from 1-30 minutes.


how many data points do you backtest over

Depends on the strategy a bit. For intraday I generally do a backtest over the previous 4 months. Generally I pick random sets of ~ 100 stocks and run my strategy on them. I keep doing this with different sets of ~100 until I have either tested it on all ~1000 "trade-able" stocks or I have somewhere in the range of 500-1000 trades taken in the backtests. If I try to run many more than ~100 stocks at a time or over a longer lookback period than 4 months it will either take forever or crash Portfolio Maestro (or more often than not, take forever AND crash Portfolio Maestro right as it is finishing up).

If the results look reasonable from this I then take a handful of good and a handful of bad ones from the original backtest sets and run a few more tests using a larger time interval for the trades (typically 1-5 minutes depending on the strategy), and run them further back and only up to the start date of the original backtest start.

If results still look reasonable, I start running the scan and code each day and monitoring the results. This is where my "theoretical" curves come from. Then finally if they still look good I take them live.

I am less interested in the specifics of your strategy's​ and more the tools and tech setup you are using.

Probably wise...all you would get if I gave you the codes to my strategies is a smaller bank account.
 
Longer update to follow later, but for now, I think I may have determined another reason my actual trades are/were (not so much anymore) having a hard time matching up with my theoretical...


That is a trade my theoretical system took today (profitable). As indicated from the image, I did not get a fill...very curious since there were two ticks below my order. My best guess is that since I am trading odd lots I am getting slightly ****tier execution than I would be if I were trading normal lot sizes. Anyone have another explanation for this phenomenon? I put an inquiry into TradeStation but I suspect they either: will ignore my question, or they will tell me it is because I am trading odd lots and the trades that executed had specified no odd lots.

I am hoping that it is because I have been trading odd lots because that is an easy fix. I have had about 3 missed (profitable) trades since starting the revised version of this system, so it could make a notable difference if I can get those executing.

You need to look at three things before commitng real money.

1)Mistakes will eat up your profits , a thread here explaining

http://www.trade2win.com/boards/educational-resources/223432-mistakes-make-losing-traders.html

2)The psychology in real trading
Read some psychology threads , they may show you where you will go wrong or you will read them after disaster.

3)market timing
A good article in market timing here , forget the hindsight technical anylysis

http://www.trade2win.com/boards/edu...22-what-happens-when-you-try-time-market.html

http://www.trade2win.com/boards/psy...ent/30027-psychology-poll-46.html#post2906550
 

Attachments

  • emo 3.jpg
    emo 3.jpg
    47.7 KB · Views: 186
  • emo  2.jpg
    emo 2.jpg
    45.9 KB · Views: 161
  • emotions.jpg
    emotions.jpg
    40.8 KB · Views: 166
You need to look at three things before commitng real money.

1)Mistakes will eat up your profits , a thread here explaining

All the strategies I run live are fully automated...I pick up the major bugs when paper trading them, but the implementation difficulties (if they exist) do not become apparent until you start actually live trading them. Although I am not confident in much with trading, the one thing I am confident in is that there are no mistakes being made here with execution of the system I have devised.

I even have things in place you probably haven't dreamed up yet...UPS --> check, secondary access to account --> check, secondary broker --> check. Seriously, if you are going to drop your pearls of wisdom in here at least skim over the last couple pages to see what I am actually doing.

2)The psychology in real trading
Read some psychology threads , they may show you where you will go wrong or you will read them after disaster.

See my response to point 1...my programs do not get emotional when they are in a winning or a losing trade, they just keep chugging on as I have programmed them to...so...no psychological decisions being made during my system trading.

3)market timing
A good article in market timing here , forget the hindsight technical anylysis

So I suppose we should all buy and hold SPY? Well if the buy and hold is your thing than ok...I am looking at a longer term strategy currently. While it certainly is fantastic to just buy and hold until you turn profit, the problem is your capital can get tied up very quickly doing this. I think diversification is the key if attempting something like this...which I am looking at but don't really expect it to be any answer worth pursuing.

Feel free to drop more pearls of wisdom, but before you do, actually read what I am doing please, as 2 of your 3 points are completely irrelevant to me.
 
So I suppose we should all buy and hold SPY? Well if the buy and hold is your thing than ok...I am looking at a longer term strategy currently. While it certainly is fantastic to just buy and hold until you turn profit, the problem is your capital can get tied up very quickly doing this. I think diversification is the key if attempting something like this...which I am looking at but don't really expect it to be any answer worth pursuing.

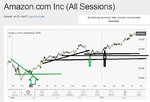
I think you will find swing trading much more profitable .Here Amazon stock gives a 10% plus gain , using options costing <1% can give a 10 fold return (1,000 %) on capital risked .You just have to find 1 winner to make up for 9 losses , but you can get 50 % + hit rate .Tying up capital can be avoided.This requires anylysis and patience to wait for the entry and exit

About 10 years ago , I knew Amazon would rise , but I did not have a method.
 

Attachments

  • amazon.jpg
    amazon.jpg
    21.7 KB · Views: 164
I think you will find swing trading much more profitable .Here Amazon stock gives a 10% plus gain , using options costing <1% can give a 10 fold return (1,000 %) on capital risked .You just have to find 1 winner to make up for 9 losses , but you can get 50 % + hit rate .Tying up capital can be avoided.This requires anylysis and patience to wait for the entry and exit

About 10 years ago , I knew Amazon would rise , but I did not have a method.

So you ''just need'' to find a 1000% winner to make up for the other 9 winners.
Not one in 10 or one in 100 options go on to pay out 10 times premium.

I could say lets start making money on the horses and you just need to back a 100/1 shot and if you manage that 50% of the time you'll be in clover.

I think writing that, with no methodology at all is pointless, pretty much same as coming to a scalping thread extolling the virtues of long term trading.
 
I think you will find swing trading much more profitable .Here Amazon stock gives a 10% plus gain , using options costing <1% can give a 10 fold return (1,000 %) on capital risked .You just have to find 1 winner to make up for 9 losses , but you can get 50 % + hit rate .Tying up capital can be avoided.This requires anylysis and patience to wait for the entry and exit

About 10 years ago , I knew Amazon would rise , but I did not have a method.

If we are doing hindsight trading with options now (could have sworn you mentioning it was useless and served no purpose somewhere...maybe it was here ) ...why wouldn't I just buy my net worth of options in GLYC last Wednesday?


The stock has moved up ~120% since then so it would have provided me with a nice cushy 120 fold (12,000%) increase in net worth. WOAH...wait a second...I would now be a multi-millionaire with that one hindsight trade and could now retire. Thank you foroom lluzers! Your hindsight trading suggestion will surely make me rich quick!

What I meant is , if you use options , you don't need to tie up all your capital .This I do in my foresight trades .
 
Here is an example of Tessla shares traders were loading upon with options.They are now over $300.

At the same Amazon was good buying opportunity around $770.

This is not hindsight , but when you see technical opportunities , leverage with options in trending markets or high probbility swing trades.
 

Attachments

  • tessl.jpg
    tessl.jpg
    5.9 KB · Views: 151
  • amazon.jpg
    amazon.jpg
    93.2 KB · Views: 211
  • ttttt.jpg
    ttttt.jpg
    100 KB · Views: 156
Top