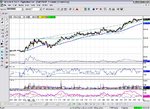
Dow Intraday charts 29/09 03/10

beauty of RSI

Lads,

cudnt hold myself from admiring today's price action! :D the lazy ones amongst us who bot CCI crossing 0 ot price crossing 100 ema @ 9:30 this morning did not have to move their little finger for the rest of the day - and wud have up to 18 pts (ES) in the bag! However, a little effort wud get as much as 31.5 pts - TRADING ON RSI only! I am attaching a 1-min chart where everything is self-explanatory, the only bit u cant quite c is downsloping res on RSI from before the session which was B/O straight away at the open.

Note the tri btwn 14:10 and 14:45 with 100 ema sitting exactly along its lower bound - perfect chance to double your long here for an extra 6 pts!

Happy Trading! :p
 

Attachments

  • cme-es03z- 1 minute (all sessions).jpg
    cme-es03z- 1 minute (all sessions).jpg
    629.6 KB · Views: 455
China - I notice that you are using Qcharts. You may not realise that there is perhaps an easier way to post your charts. On the chart, right click and select Export, Image, and save it as a .jpg file. Then it will ask you to select the quality (I use around 60%), and that's it.

That will save just the chart, and not all the program around - just thought it might be easier for you. :D
 
Thanks for the analysis China.

I'm still trying to get to grips with the various TA techniques. One of the problems I have is deciding which way a triangle is going to break. The one you identified today looks like a ascending triangle. I have pictures of all the types of triangle on my wall and it shows an ascending triangle in an uptrend will exit north. The question is can the approach to todays triangle be classfied as an uptrend as it looked to me like sideways movement?

Also you imply that this was a 'banker' [yes correctly spelt] so how soon were you able to say that it will exit north; did you need to wait for an exit direction and confirmation pullback or was it obvious before that?

I keep saying this I know but this is the only thread [on the net not just in t2w] where I get straight answers. Full credit to all contributors. [The cheque's in the post]

Bill

P.S. There are a few Ladesses as well as Lads on here!
 
So I got it nearly right in my guess for an uptrend support line. See how the "W" bottom gives us a potential target of 9480- almost touched. How did I get it? Join the tops of the "W" and drop a perpendicular to the lows- 110 points. Add that to the point where the perpendicular crosses the line acros the tops. So 9370 + ( 9370 - 9260).
So. Are we at channel resistance? If so, where is support going top be tomorrow? Where is channel support? ( They are NOT the same thing.)
 

Attachments

  • dow 01-10-03 10.gif
    dow 01-10-03 10.gif
    24.4 KB · Views: 377
No explanations needed today! The bull flag target at 9410 didn't quite get met, but you knew it would be there abouts as 9400 was tested and held just above- close enough to be met.Just depends on where you take the base of the flag pole from. Just take it from where it looks right. No rocket science there then. 9280 is as good a place as the base of the first candle at 9289... Using 9289 would give a target of 9401.
How do we know the bull flag will break to the upside? Well, at first the last peak failed to make resistance at 9344 and preconditioned me to thinking it was going to fail .... but then the final low failed to make support, confirming the odds of a break to the expected upside. China white called a triangle on RSI here... maybe so, but not one I would like to bank on. What did happen, was the formation of an RS Switch, confirmed by the pullback to 9440 just after the break.Notice also how RSI failed to make support on the final low. This RSI channel had been in force for 90 minutes. Remember the longer a trend is in force, the more likely we are to get a big break.....The mini triangle in the price gave a target of 9400 as second confirmation. No ND tops to see anywhere so just sit tight. At 9400, there was a sustained drop in RSI down to 40 from 80 for no movement in price. What does that tell you? The sellers are not interested .Stay in there.
Now we get another RS Switch. Unusual to get two in a day. Now a test of 9400 again and RSI testing LOD at 40... Still no reason to get out, finally we end up with a flat top RSI to give us our 3 peak ND top and out at around 9470. Note that just because there is no down slope on the RSI tops doesn't mean it's not divergent.
Where to tomorrow? Closing at HOD can mean a continuation, BUT as we have had a large move today, It may be a case of too much too soon, so look for a drop to solid support at 9400.Top side resistance is at 9500.
With an entry at 9320 pullback, there was an easy 150 points on the table, and time for a leisurely stroll around the park. Alternatively, waiting until the bull flag broke out would still have give a healthy 100+ points.
 

Attachments

  • dow 01-10-03 1.gif
    dow 01-10-03 1.gif
    20.2 KB · Views: 366
Skimbleshanks many thx 4 yr advice - I was doing 100% and ended up clogging up all the space with my monstrouos charts - sorry! :)

Wje200 - my sincere apologies - one of the nasty habits from the floor - to call all traders lads - no excuses 4 me :( Answering yr Q: IMO since the full body of the tri was above 100 ma, the chances of a pop were significantly higher, I waited 4 the 3rd dip, saw the lower bound (which WAS 100 ma) hold - and doubled longs. I wud recommend tho to wait until the upper bound is pierced to add to yr longs, u miss out on 1 pt, but u get a safer entry, or at least do yr addition in clips. Alright THAT WAS TA - another reason for doubling at that pt u get from reading the good old tape - VIX down 6.5%, TRIN < 0.8, strong internals, down volume just pants :) - what do u reckon shorts do at every small beer pullback? Remember they r the ones sweating and stressed today - they cover WHENEVER WHEREEVER..... What r the chances for the tri to B/D? :)

CM - many thx 4 the Dow analysis - u can tell the RSI story was slightly dif't from that on ES. I was long ever since 11:00 just because ES RSI 1 min was holding above 40ish horizontal sup - still true for Dow, but not tested as much as on ES.... Goes to prove yr pt that its worthwhile to look at both.
 
CM, would u not classify the tops on the triangle between 1640 & 1700 as ND possibly forming?

I didn't see the bull flag - and to be honest, don't think I still do so had no idea about the target - was watching closely for ND and thought I saw it at that point. Maybe I was watching too closely? Also thought that might be a double top.
 
Mom, it's down to experience.... ND tops rarely form a triangle at the same time and are rarely flat. Some things, like this, you will only get to differentiate after a long apprenticeship. That's teh bonus of sticking with one instrument, you can learn it's attributes inside out and upside down.
 
Hi Chartman.
I studied your thread this morning. Very educational, both your and China's observations. Am I correct that I just saw an RSI switch in ES. CCI going back tru 0. Market back towards new weekly highs?

Please do share with youir wisdoms?
thanks
J
 
Correct, Toad. But I see a possible ND bump top on dow... RSI just peaking at 70 and ES vol not supporting another move up right now....
 
PS that ND is across yesterday's close, so I'm not attaching total comitment to it, especially as we gapped down.CCI on dow looks like it's making RS Switch too.
 
Price moved up with the channel line a tad today, and has now formed a triangle.... Thing is, RSI is in divergence. Insufficient data to say which way it will go,especially as the price is sitting slap bang mid channel.Upside break target around 9575. Downside 9400, which sits spot on channel support. 9575 is the best fit to channel boundaries.
 

Attachments

  • dow 02-10-03 10.gif
    dow 02-10-03 10.gif
    23.2 KB · Views: 447
From comments earlier, the RS Switch on CCI didn't happen.... The possible ND across yesterday's close looks like it did deliver a top. Ignoring that, there was a clear double top at 9500, where you would expect a test and drop if it wasn't going to go through. Both confirming the other, if you like. And the rest? Looks very nervous, doesn't it.... A long off the PD bottom gave two out possibilities- the third test of 9500, ( and a sort of ND, but you don't get a middle dip, so discounted!) or the 3rd peak ND at 9510. Ask yourself this.... Was the sweat of the drop from 9500 to 9480 worth the extra 10 points to catch the real 3rd peak? I don't think so. Taking the 9500 was the prudent move. Greed is the undoing of a lot of traders, where having seen a nice profit missed, they hang in there in the belief ( sorry, HOPE) that the price will come back and they will be rewarded for their patience. Dream on.
 

Attachments

  • dow 02-10-03 1.gif
    dow 02-10-03 1.gif
    21.5 KB · Views: 447
CM, was that a triangle between 15.50 & 16.25 - I saw it as one and traded it on the break. My only other entry was a short from the double top with exit after it crossed the 100MA.

Figured that after a big move the day before it was going to be choppy as usualy seems to be the case.
 
Yes, with a 20 point target that got met, but didn't follow through. You're right about big moves being followed by choppy ones.
 
Whow, it is going to be interesting! Do you ever look at the YM contract during the pre-trading hours?
Keen to hear your views for today?
thanks
 
Is it my imagination or are YM/Dow slow to react to figures coming out? I sold 88 on YM and it came back to 75.
In Ftse future the reaction seems almost instant on the release of figures, ie you don't get a look in.
 
I had similar experience with IB. But also miss es data between 10am and 13:00 in eSignal. Something wasn't working.

Anyway waht is market up to? Is thi s pause before next leg up or early signs of exhaustion?
 
Top