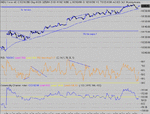
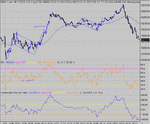
Dow Intraday Charts 22 Mar - 26 Mar

Time to own up... I totally missed the PD on the bottom of the bull flag and couldn't chase the break. I was wary of the extended bull flag, thinking it was going to go all day... But I did catch the RS Switch. But then I closed out on the ND top ( or so I thought), only to watch it creep up, and up... The target of 190 was tongue in cheek, as it relied on the Gap and yesterday's closing low, which generally is a bad thing to do. Realistically, the flag had a target of 120, ie no gain. I'd fooled myself into thinking 190 was tops. This looks good for a follow on tomorrow, but the 10 min chart says not.
 

Attachments

  • dow 25.03-04 1.gif
    dow 25.03-04 1.gif
    21.4 KB · Views: 353
What is Commodity Channel Index and what is the reasoning behind using here in the charts.

Thanx
 
Not used much, but on the 10 min charts, provides OB/OS indication at +/- 200 ish.
 
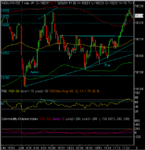
Adam and Eve setup anyone, looking for 264…..?

Or is it a Friday afternoon hallucination……! :eek:

Views welcome as long as they’re not too rude……. ;)
 

Attachments

  • 26-03-04.gif
    26-03-04.gif
    18.3 KB · Views: 420
and 250 for T2. :)
edit
250 is the triangle target ... RSI 80 is OS so 64 a bit later. I guess we'll close at 332. Now that would be nice :cheesy:
 
TS, looks like Adam wants to stay up for a little longer :cheesy:

270-77 target from triangle.

Also started looking at fib levels after TS's success. We have got a .618 retracment from oct lows to highs of 10750 at 10273.
 
Anmo. If that's your estimate of the triangle from the open, I think it's too high....... It should be 250/255....
 
CM I am not always sure where to take target from. Where have you taken target from?

Thanks
 
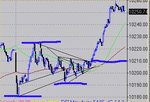
Hope you can see T1 and T2 from this
T1 is (210-190) +210 = 230
T2 is (225-180) +210 = 255
 

Attachments

  • image1.gif
    image1.gif
    16 KB · Views: 395
Thanks CM, I have never looked at triangles from that aspect. I have always tried to take the diference between the top and bottom of the triangle and added that from the breakout.
 
I think we were looking at different triangles.

I was taking the triangle top over the top of yesterday and over 3pm peak and then taking the target from the 10230 breakout.

Looking back at that it isn't a clearcut triangle, more of a channel resistance.

Sorry for the confusion :rolleyes:
 
Breakout and pullback to support at 215... so room for some upside.
 

Attachments

  • dow 26.03-04 10.gif
    dow 26.03-04 10.gif
    36.3 KB · Views: 339
Alternate view to the triangles maybe? A bull flag , target 235. Nothing to show in the way of divergences really, but some good points to be had again.
 

Attachments

  • dow 26.03-04 1.gif
    dow 26.03-04 1.gif
    24 KB · Views: 317
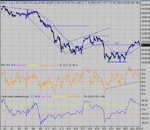
Just wanted to get your thoughts on how you measure your targets for flags etc...this is how I do it??
 

Attachments

  • jkhh.gif
    jkhh.gif
    63.3 KB · Views: 298
Top