Dow Intraday charts 20/10 - 24/10

CM
Oarsman's query is spot on. While I did recognise the RSI tops and weak market rise, I felt a no point comfortable putting on a short trade (without feeling a gambler).
Today, we may have another one of those days. YM is down 80pts (0.8%). SPX gap (3Oct) is on verge of being filled. Market could go either way. Bouncing of current lows or continue its dwonward slide. Especially, in case of slide, do you have any tips on what indicators give extra attention?
Thanks
 
Getting in at the open is mostly difficult. Not the least that the SB co's will have their bias maybe 20 points ahead of the price. Direct access through, say, IB may be easier. Anyone clarify that?..

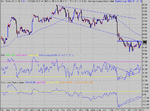
Now, RSI. You need to keep an eye on each up move and down move and calculate the ratio of RSI to price move. This won't predict a big move, but it WILL tell you whether to stay in the trade or not. In a down trend, we're looking for moves that, for a given move in RSI, will produce less points in the up move than the down move.( and vice verca)
In the example, we're short, and looking for a cover, or continue. The price went up by 28 for a rise in RSI of 47. So 28/47 = 0.59. RSI ratio < 1 = weak so we know that up move was weak. Now the down move = 48/44 = 1.09.Much stronger. So we can now decide there is little point in closing our short. That doesn't mean to say that the next move will not be huge!You never know what the next move is, EVER. But you can base your decisions on probabilities of likely outcomes based on historic evidence. The likely outcome at 15:50 is that either the down move will continue, OR there will not be a big break to the upside, so we stay in. Add to that a rigid stop loss plan. In this case, a move above 9670 and the trade is closed.Period. That's your safety net for when the market decides to go against your best decision, and everyone else's probably.That's why we have stops.

Work out the ratios from 18:50 to 19:40. Did you get an increase in the RSI up move strength? Good. There's three clues here. RSI strength, CCI divergence, RSI Divergence. All before the price made a higher high.
Hope that helps.
 

Attachments

  • rsi_price.gif
    rsi_price.gif
    54.9 KB · Views: 461
Hi CM

RSI strength seems to be an important indicator & we've seen it discussed quite a few times on these boards. It would be useful for us if we could graph RSI strength on Sierra as this would then save on calculating the values by hand. Have you tried to do this? - if so can you let me know how its done.

Thanks

A&L
 
CM, ref your comment about it perhaps being easier jumping in trading direct rather than via SB - personally I dont really think its any easier, because you know how much more choppy futures are than cash.

I find I sit there and think "Hmm, should I short this?" and you hesistate a second and the price whips back through where your stop would have been....so you dont take it. Then of course the market turns and goes where you originally thought. So then you think "Ah, shall I get in now?" blah blah blah.

In the end I ended up widening my stops a little and it makes it somewhat easier ; OK so if you go short at, say, 9525, you're in profit - technically - at 9524, but you can be back out again and down in a flash. It still takes me some doing to press the button on occassion, but I wouldnt say its actually any easier than SB, just more profitable.
 
I personally think that SB trading, particularly for intra-day trades, is becoming increasingly more difficult due to the relatively high spreads & the "skew" that SB companies such as D4F always seem to have. Lately it's been easy to lose & very hard to win, even though you use a consistent approach. As a result we expect to move from D4F to IB shortly & trade futures direct. As rossored says, trading direct is no easier than SB, but at least there is potential to make more cash. :)

A&L
 
CM

Thanks for the RSI tutorial, I think I am getting there!

As far as big moves on the opening are concerned using SBs and this system means that you are almost always going to miss the initial move. Firstly because the SBs will have factored the move into their price before the open, so the only way you can get the move is by placing your bet out of hours before the futures have moved too far, which is a gamble. Secondly because you should not enter a trade if CCI is <-200, >200 or RSI <20, >80, which it usually is on a big move. ( CM I am right on this?)

So coming back to the other problem when do you enter? Looking at yesterday's chart should it have been at 15.30 because it had hit the magic 64 and not broken through and RSI was weak? Or is that too easy in hindsight?
 
Austin & Liz

RSI is a strength indicator.... What you really want is an RSI Ratio indicator. I'm sure some wizz kid could write a DLL and enable you to have it as a "custom indicator". Sierra allows you to do this. Sadly my programming skills are zero, so I can't help. Any offers? Maybe it's just not possible.... :(
 
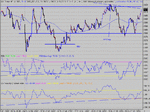
Looks like 9550 is a bottom out, with divergence coming in strong. Come back 9900, all is forgiven. :(
 

Attachments

  • dow 23-10-03 10.gif
    dow 23-10-03 10.gif
    35 KB · Views: 391
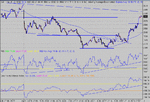
Solid resistance from yesterday at 9620 held up nicely today, making for some easy pickings, especially the H&S top @ 17:30. A half chance entry for a long off the theoretical support near 9550 and a close as resistance test failed. Next long coming off 9550 again, as the price bounced off 9564, with an out at the H&S top. ND set in , but was too short at under 20 mins, so that helped confirm the close.
 

Attachments

  • dow 23-10-03 1.gif
    dow 23-10-03 1.gif
    31.3 KB · Views: 343
Hi chaps,

For those of us who are using lycos charts for various reasons - u may want to use them in conjunction with bigcharts - found that i'm picking up the TA and seeing the bigger picture much better using bigcharts.

Plus, u can expand to longer time scales, draw trendlines. S/R and narrow down to 1 min with the lines scaled accordingly - just like sierra - downside is it's not streaming - use lycos for that.

http://bigcharts.marketwatch.com/javachart/javachart.asp?symb=djia&time=1
 
Oarsman
Hindsight trading is a piece of cake and is something you never get when trading for real. The problem is really having the courage of your convictions to hit the button. Some ppl do it compulsively because they are gamblers ( most, dare I say). The real skill comes in making a deliberate decision to not trade UNTIL you see, in your opinion, a clear cut opportunity. These, in all honesty are few and far between. One or two a day maybe. There are those that have sufficient experience to err on the side of good probability and get it right most of the time and when they don't, they get out super quick.
As for trading at the extremes of CCI and RSI, I would say it's a perfect opportunity to get in at a top or a bottom for a reverse trade. i.e. if RSI >80, the only way is down, statistically. It may go up a bit more, but then that's where the skill comes in in applying your stops- just above resistance.
I think you meant 16:30 as the entry time- yes, I'd agree, but if you want to play super safe, always wait for a pullback to occur to give you that second confirmation, in this case it was at 16:46. Often you can get a better price entry by waiting. On the 64 break, you'd have probably got 75 to buy from an SB..... at the pullback you might have got 70 or less. If you're a real gambler and are convinced it's going up, you could buy on the down tick just before, and maybe get a price of less than 65 to buy...... but that's for gamblers.
There is really no simple or easy answer as to when to hit the button, and from what I can tell, the closest you will get is on trading USA Level 2 and following the axe.- See Naz's posts.
I'm convinced that one of the elements for success is to trade at a price per point that never scares you into making a rash decision.You should be comfortable with your position at any time, such that you can afford to sit back and look at what's happening for a couple of minutes without having the burden of a huge loss. This is why you will see so many comments about ppl closing a loser, only to see it turn around the next couple of ticks. There is a fine line between this and just letting a loser become a monster.
 
ChartMan

I agree with everythig you say. In my view too many people, especially early on, trade on hunch or a belief that the market must go in a particular direction, and then get upset because the market didn't agree with them! This is why I like your system, there is none of this "I think we will see a down day today followed by a late rally" stuff, but a straightforward trading what you see based on the TA.

I am not natuarally a gambler, which is why I like to see signals before entering a trade. We are getting there, but as you say there may be only one or two real signals a day, and it gets very frustrating if you keep missing them! So for my benefit if no one else please keep up pointing out the entries!!

Many thanks

Charles
 
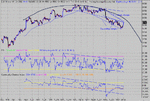
Another hard day to trade..... There was one point where the 32 failed to produce a winner, as it rose and dropped down through a short while later. A classic example of taking a trade based on past knowledge, but the market thought different. If you were smart, the trade would have been closed as the price went through 32, into a loss. If you were really an the ball, you should have seen that near resistance ( and yesterday's) was at 9550. It was tested already 5 times prior to that 32 entry and twice after wards. those two tests at 9550 after wards for a double top should have rung alarm bells that it wasn't going to break. Maybe this was a bad entry, going long so close to resistance? Another day it may well have broken through.... The situation was made more convincing by the PD from the open. Oh well... Had you taken a short from the top at 16:00, I guess the thought of going long at 32 would never have come into the equation. The bounce off 32 would have been expected, and the bounce down off 50 too. So where to cover? Tracking RSI strength showed weakness on the pullback from 30 back to 9500 and divergence. Covering at the second 9500 would have made sense.
Take a look at the characteristics of the two sideways channels. They have the same characteristics of a Bull/Bear Flag that has an early warning of the break. This is where the third peak fails to make support / resistance.These are generally equally spaced peaks across time, so you can estimate where the third one should be in time. Clearly the first was way short on a peak, only making 9550 at 17:15. The second failed to make support at 9550 at 20:15. These are conditions that you can use to pre plan an entry, OR an exit. The Gambler/experienced trader will take an entry on this failure.The safe player will use it to plan his entry, knowing the channel breakout is the likely outcome. There's little point in waiting for a move if you don't have some idea of where/when it might be. By the time it hits you, the SB has it 20 points ahead.....At the end of the day, there is no substitute for experience. From my lengthy reply above to Oarsman, it's clear that to get that experience, you have to stay in the game long enough to aquire it.
 

Attachments

  • dow 24-10-03 1.gif
    dow 24-10-03 1.gif
    27.3 KB · Views: 326
Apart from the 1 min chart analysis, there was a clear channel break off 9500 bottom on the 10 min chart on RSI. What really frightens me as an eternal bull, is that history tells me that down moves will generally exhibit 3 or 4 slope changes in the price. So far, we've had two. To get another one, there will need to be one hell of a drop. That looks like 9250 . The other feature is a rounded top. What do I see? We know from TA theory that expanding triangles lead to high volatility. RSI and CCI are at resistance and on a break have little room for movement. Their respective supports are a long way off... Whatever happens, expect a big move, I guess.
 

Attachments

  • dow 24-10-03 10.gif
    dow 24-10-03 10.gif
    36.5 KB · Views: 343
Interesting reply you gave to Oarsman CM

Set me thinking about trading psychology. It's the section of the 'book on trading' one tends to skip through thinking, "yeah yeah, I'm OK with that sort of stuff, I can handle it, lets just get on with the technique".
A natural reaction I suppose and whilst the understanding of TA techniques is important the ability to implement them is equally important. I'm speaking from bitter recent experience.

One of the problems is that we mainly learn by our mistakes and successes. [Hope this is not too heavy] As children we learn that hot things burn so we don't do that anymore. We learn that good behaviour is rewarded, bad results in a less enjoyable existence. This I believe is something instilled in us from a very early age, action and result. We do this we get that, almost every time. Try teaching a dog to do tricks. Reward him with a bone he likes it and does it again.

If we apply the same principle to stock trading the outcome can be very different. Let me explain. We look for cause and effect and for a while the Dow index can provide that. I remember a last year about this time I discovered RSI and the particular setting I chose meant that, for a couple of weeks at least all I had to do was sell at RSI > 80 and buy < 20 and I would make profit.... very few exceptions. So I had found it the holy grail! Wonderful! Except that after that period the RSI very seldom reached 20 or 80. Oh dear. And very soon when it did reach these values the outcome became unpredictable.

Here's another. I think it was around spring 2002 when the FTSE was trading in the range 5000-5300. All I had to do was buy below 5100 and sell above 5200 and make profit. Worked very well and as more successes came along I increase my stake. Holy grail, here it is! Can't possibly go much below 5000 can it? No stop losses in place [for goodness sake don't lecture me]. Well history shows it can go where the hell it likes and did. Fortunately, and about the only thing I did get right, the stakes were pennies, even after increasing the stakes. I lost maybe £2k, well within my means. Just as an aside there was a comment from China White talking to someone in the chat room who had lost substantially more than that. He said that the experience is the best training you can get. If you read this China you have probably forgotten the line but it has stuck with me ever since, clinging to the hope that my 'learning' in that department is over!

Does any of this ring any bells with anyone? Or am I on my own?

Another approach, which I am sure has been tried many times. Bought UK stock history data from the year dot and wrote TA programs to back test each of the many TA techniques available. Back testing is a good idea but is no indication of how well the TA indicator will do in the future. If enough indicators are tested on a set of data then it is statistically likely that one or two will show a positive result on that particular data set. Change the data set and they will fail. Worse still is to take the few best TA tools from the test and alter their parameters until they produce even better results. That is self delusion! Fortunately I realised that before committing money to it.

As for stop losses, that is a hard lesson to learn. It is very easy in a range bound market to work without them, as long as there is sufficient margin. On a purely statistical basis the larger the stop loss the better the performance [might do a proof of that in the next few weeks, note 'statistical' i.e. completely random]. By not setting them and closing on a 3-6 month time frame mostly it is possible to get away with it. Again it comes back to our inbuilt learning instinct. If I don't set stop loss I make profit; never take a loss! No amount of good advice from this site and others seems to make a difference to the inexperience trader. Maybe, as China said, we can only learn by our own mistakes.

Now to my more recent attempts at CM's Dow strategy.
Again all the time I come up against pre conceived ideas about how the price ought to behave. For example when the price meets resistance what is it going to do? Well the last 5 times it went through so this time it must also be going through. Do you see the problem? It did it 5 times so it must happen a 6th. We learn all our lives through repetitiveness; it's instinct. Here's another, not recent I might add, at 8:40 the market always moves in one direction! Don't laugh. Self delusion. Maybe it does maybe it doesn't but mustn't trade as though it does. Has anyone else convinced themselves that the market moves in a particular direction at a particular time of day? You are destined to lose. The thing is if it does that for several days or weeks on the trot it is easy to convince yourself it always does that. At the moment we have a situation where the Dow makes most of its moves out of hours and we miss all the good moves. What are you gonna do about that? Modify the way you trade to accommodate it? Well its happened 5 or 6 times over the last few weeks so it must always be going to happen!

So maybe now you understand what I mean when I say I have trouble with the psychology of trading. How can I forget all I've learnt about cause and effect and just trade what I see using the indicators and Dow technique. At the moment this seems an insurmountable task. Pre conceived ideas get in the way. Does anyone else feel they are missing something if they are not in a trade by 3:30pm? If the price starts to move strongly in one direction do you feel the need to 'jump on the bandwagon' in case you miss the big move of the day, after all, the big moves are few and far between.

Apologies for this CM, but on the days when you say 'nice easy 100pts' and I've made a complete cock up and missed the lot I get depressed.

Actually today should have been good. there was a big H&S to start and W bottom in the latter half of the day. Missed most of it though.

Anyway hope I haven't bored everyone too much and if anyone has any good tips about how to block out the nonsense for goodness sake let me know!

Bill
 
Last edited:
Bill, yup - rings a bell :)

agree with just about everything u said i too have missed the 'easy 100 points' - in hindsight I think 'how the hell did i miss that' - doean't help when u've gone the other way either :)

Yup, i get angry and upset - but forget about it after a day or two - until the next time it happens :)

It takes time, patience and practice I guess - plus the sheer bloodymindnessness (!) not to let the thing defeat u !

Cheers and good luck !
 
Every one takes a big hit once in a while (as long as its not very often) and as Chartman said the hardest thing is to stay in the game.

Does anyone think the trend is still down by looking at the 10 min chart above?
 
From a pure guess point, and using EOD candle charts, I've gone for up in the dow comp. But don't let that sway you in any way. It could go either way !
 
Top