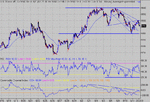
Dow Intraday charts 08/09 12/09

CM, after the h&s delivered, I closed at 9450 which was the major support line - in the past at these support points the thng has bounced and I didn't want to take a chance. What made you stay in? Was it the fact that the h&s delivered 'cos the price/rsi ratio on the way down wasn't particularly strong? Mind u, the pullback from 9450 was weak - is the lesson here to watch the pullback for strength and then decide? I only ask because if it is a real bounce, by the time u've recognised that, the spreadbetter's bias will have killed you.

Would appreciate your thought process on this one.

I guess I should have gone back in when the triangle formed, but was too late.

Thx
 
Chartman,

Is there somewhere in your previous postings where you explain 'targets'. How do you arrive at T1, T2 etc?
Can you run through the process if it's not explained elswhere.

I've read that some people use % of movement, others use ticks (points) of movement to determine targets. More than a little confused on the subject. Can you shed some light on this area when you get a minute.

Thanks Zebra.
 
Mom, it's a case of damned if you do and damned if you don't. The name of the game is profts. lots of them. lots of small ones if you want, but most of all tiny losses all the time. You have to decide for yourself whether to risk staying in for more profit, or banking what you have - just like " the weakest link". Obviously, if you have already got some points in the bag, the decision is easier. What if you are only 5 points up? stay in , or risk the next tick taking you into a loss. Not easy, and no single answer.
Yes, taking the strength of RSI , in both the last up move and down move should help the decision process....
Zebra. Targets are classic TA items. Triangles, bull flags etc all have calculated theoretical targets IF the formation works. We call this "delivering". If a target fails to deliver, then the prior TA formation has failed.Therefore the major move that that TA was part of is at an end. Take a look on the many web sites that show TA formations for more help.
 
Thx CM - thought that might be the answer (ish) but guess I was hoping for a TA based reason :(

Did learn loads yesterday and after analysing what I did etc from your analysis & charts - excellent!

Also, have to remember this is hard work - I've stopped analysing your postings in depth apart from the usual morning read - used to do that a lot as well as going thru the historical stuff all the time (on the train, w/e etc) - thx NB for the downloads. New job kinda put a stop to that for a while but am gonna start again. Did a little last night and it kinda clicked back again - practice makes perfect one hopes !
 
Rustic, no, not really. It looks like one, but in fact it isn't- even though it did have the same follow on characteristic of an H&S. It was an 3 peak negative divergent top. I'll try and find a real H&S from my archives and you can study the difference- it's subtle.You're basically looking foy synnetry in the form. That one this afternoon was all lopsided.....
 
10 min chart is now a mess. I can't see anything worth noting, except the 200 point wide channel. S&R 9400, 9450 , 9500.
 

Attachments

  • dow 11-09-03 10.gif
    dow 11-09-03 10.gif
    28.1 KB · Views: 407
Strange day again, seeing multiple ND tops again. A false drop through the 100MA to take in shorters...no answer to that, bar cutting any loss asap.Taking moves in 20 point steps was not very productive at all, especially with each move ending in divergence. A hard day in all. Probably more to do with lack of interest in the markets today in general. Certainly very thin on volume all day with everyone paying attention to 911 memories.
 

Attachments

  • dow 11-09-03 1.gif
    dow 11-09-03 1.gif
    20.1 KB · Views: 389
Thanks for the analysis again CM.

Like Rustic I also sold on the 'false' H&S right shoulder. The S+P version was more convincing and I traded the Dow on the strength of that. The move down from there I assumed contained a bear flag so I managed to wait till near the bottom before exiting.
It was not all good though because I took a short about 6:30 based on the RSI ND. then when it went up to test 9500 it took the stop [plus a few more panic moves which I'm too embarassed to talk about]. Anyway came out @ +18 pts for the day which is OK I suppose.
This is the first week I've tried to trade using chart patterns based on your commentary and comments from others.

Thanks again for your guidance and to all contibutors to this thread.

:)
 
Hey CM, waiting for your friday analysis - one particular bit I wanna check on whether I did the right thing or not - that was going long on the pullback after the up break through 9400 and 100 MA (11.15 NY time) - didn't spot the triangle at the time - and then staying in despite the drop - ok I got rewarded at the end but maybe I should have got out earlier? - couldn't see an exit at that point. The small bear triangle after that drop (between 11.45 & 12.30) had me on edge but had figured the target was gonna stay within 100MA - 20 and above 9400 so I held on - was hoping it would break to the upside actually.

Also, was that a big triangle that broke to the upside between 11.01 & 2.00 - sorry about NY times but that's what I get with bigcharts.

Must admit I did go long after the big 2 drops at the open (both bad sets of data related) - saw the PD and took a chance but then chickened out and closed for a few points.
 
Sorry for the late post.... the 10 min chart looks a little better now and I'll be looking for a down channel break Monday with the "W" bottom delivering...Maybe... Why? the last major bottom failed to make the support line by 30 odd points. Why not join up the 3 lows? Beacause I don't think that's how the DOW works. The DOW prefers to run between parallel trend lines and joining the 3 lows conflicts with that concept. We'll see.
 

Attachments

  • dow 12-09-03 10.gif
    dow 12-09-03 10.gif
    30.3 KB · Views: 340
Mom, great entry, U missed the triangle- bad. The triangle gave T1 at 9435- made that ok. See the little pullback just there? Well that target , T2 , 9445 failed and the tiny pullback to 9430 that carried on going down should have signaled out. This was an attempt to regain the target. You get 1 chance at a target, then a retry( sometimes). If that retry fails, it's a definite out. As it was, you should have been measuring that peak downmove strength ( weak) to see if you were going to hold and stay in. T3 was two targets... One from the big triangle, as you saw, the second was from the bull flag. Having one target from two different time frames is a strong confirmation of delivery, as it did. Out on the ND top, either the first one, or the second one. Either would only have made a few points difference. handy, as those disposed to banking safe profits had their exit, and those that like to squeeze that last bit got their exit too. It's all a balance of certainties against uncertainties. If you are uncertain, STAY OUT. No loss = winning against the majority. Go in with the certainty of a positive outcome, like the two triangle breaks. the second was a hoot because it didn't fly, instead pulling back gently to the break line before flying. Loads of time to get in with minimum bias! The earlier triangle probably had at least 10 points bias on the cash...
 

Attachments

  • dow 12-09-03 1.gif
    dow 12-09-03 1.gif
    21.1 KB · Views: 298
What's T1, T2 etc.

Sorry for such a basic question, find the charts very informative but not sure what T1 , T2 etc. is.
Maybe Pivotes or Elliot wave ??.
-
 
From TA basics, the triangle formation at 16:00 ish has an expected price rise to T1. etc.
 
Newtron Bomb said:
Targget 1 and target 2.... download the dow trading strat its all there for you

HTH

Can you please post the link to the above dow trading document.

Thanks.
 
Top