You are using an out of date browser. It may not display this or other websites correctly.
You should upgrade or use an alternative browser.
You should upgrade or use an alternative browser.
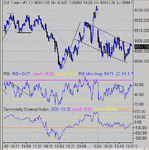
Here's a new piece of TA that you don't see very often in a clear cut format. It's the small horizontal channel that acts like a bull flag. It has the same form, and has the same target calculation. Don't forget that the flag pole is from the last "reaction low". In this case, it is at 9875, NOT the opening low of 9867! The form is 3 highs, 3 lows and then the breakout. Note also we had two targets here- the flag and the 3 pk ND top. both the same. What more do you need for confirmation of a top?
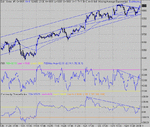
Following on this to a logical conclusion, it is no surprise that we see the result of the mid session parallel channel drop back by the same amount that it went up by- to 9875.
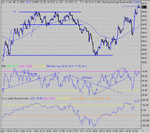
Here , we see another common issue. A very convenient and easy decision for taking a trade at 7pm UK time. You had time from 6:30 ish to examine the day's action and decide that here was a good point to go long ( confirmed by the vol divergence on ES at 7:04) The only sad part of this latter action was the big drop just after what appeared to be a nice bull flag. No doubt a lot of you finally decided to close the long , only to see it turn around a few minutes later nad climb back to close at HOD. That is just so soul destroying. By the time you have recovered from the misery, it's too late to start rethinking rationally and taking advantage of the few points left on the table. It's one of those situations that forms part of the learning experience. It looks worse here than it did in real time, and the drop from the channel was only 13 odd points, so maybe you didn't get shaken out. Tick by tick, the ES turned around 1 minute earlier than the DOW, and the Doji Star on ES confirmed the bottom....
Attachments
neil
Legendary member
- Messages
- 5,169
- Likes
- 754
jaykay3 said:Excuse this question but what is this ES you keep talking about ?
This be it :
http://www.cme.com/prd/overview_ES702.html
😀
tradesmart
Experienced member
- Messages
- 1,286
- Likes
- 22
Well, is this a long,short, phone a friend or ask the audience??!! 😉
Took the bull by the horns and went long at 9885 based on a little PD on the 10min chart and a seeming avoidance of full tankmode.....
hope there isn't a 'tuition charge' looming...........! 😢
Took the bull by the horns and went long at 9885 based on a little PD on the 10min chart and a seeming avoidance of full tankmode.....
hope there isn't a 'tuition charge' looming...........! 😢
tradesmart
Experienced member
- Messages
- 1,286
- Likes
- 22
That looks kinda bullish to me CM! - nicely timed!!
WE HAVE LIFT OFF............!
:cheesy:
WE HAVE LIFT OFF............!
:cheesy:
Sometimes I'm blessed with timing perfection, but would you be of the same opinion if I posted 10 minutes after the event?
A note :- don't dismiss /ignore what happened yesterday- it IS relevant. What you do have to ignore is the closing /opening garbage. That's the mm's making their beer money . Remember garbage in= garbage out.
A note :- don't dismiss /ignore what happened yesterday- it IS relevant. What you do have to ignore is the closing /opening garbage. That's the mm's making their beer money . Remember garbage in= garbage out.


