You are using an out of date browser. It may not display this or other websites correctly.
You should upgrade or use an alternative browser.
You should upgrade or use an alternative browser.
lemput said:that support on the 11050 is getting annoying now.
tell me about it 🙁
leovirgo
Senior member
- Messages
- 3,161
- Likes
- 156
Investigation of Fannie Mae Points to Former Finance Chief, Controller for Accounting Failures
WASHINGTON (AP) -- An extensive investigation of embattled Fannie Mae points to its former finance chief and controller as mainly responsible for the accounting failures at the mortgage giant now struggling to emerge from an $11 billion scandal, said a report released Thursday.
---------------------------------------------------------------------------------------------------------
We may need a bigger scandal than that for free fall.
mark twain uk
Established member
- Messages
- 618
- Likes
- 4
managed to close half of my short from 150 last night at 055, nice 95 points, placed the rest of it on B/E stop, nice when everything goes according to plan :cheesy: :cheesy: :cheesy:
mark twain uk
Established member
- Messages
- 618
- Likes
- 4
closed the rest before the B/E for a little more profit, the bounce is very convincing
chimpmagnet
Active member
- Messages
- 124
- Likes
- 3
Gap Man said:Depends on your perspective - 3 longs taken - avge 11074 - looking for a huge turn by 16:25 or I'm out - 11035 stop
Good call on 16:25 turn. Why was that time period so precise?
I couldn't find anything on the usual websites. 😕
The only thing I noticed was crude dropping during the 30 minutes or so before that time.
I used to trade this kind of set-up a year or so back - hasn't been prevalent of late - but when I see it its nice. Used to be a regular Weds / Thurs thing - Its one of those set-ups that you just notice - doesn't always work but the 16:25 thing is just that by then its shown its hand - soemtimes after basing at a new low from the 15:15 - 15:30 low (based on my memory and notes).
I'd expect this to trend upwards all day now - might backfire but I hope not...
I'd expect this to trend upwards all day now - might backfire but I hope not...
frugi
1
- Messages
- 1,843
- Likes
- 133
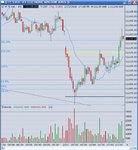
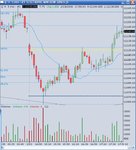
Darth won't approve but we've had some jolly nice Fib extensions and retracements today...
You can draw in the 0-100 line and then get a useful projection.
(some of the 38/61 lines are the wrong way round but it doesn't matter)
Will it be good for 11161 I wonder. Probably not as we've had 5 waves up but you never know. Will park a short order there.
You can draw in the 0-100 line and then get a useful projection.
(some of the 38/61 lines are the wrong way round but it doesn't matter)
Will it be good for 11161 I wonder. Probably not as we've had 5 waves up but you never know. Will park a short order there.
Attachments
Racer
Senior member
- Messages
- 2,666
- Likes
- 30
Individual investors have been rushing back into the stock market at a stronger pace than seen in the last few years.
http://www.comstockfunds.com/index....t Commentary&newsletterid=1225&menugroup=Home
http://www.comstockfunds.com/index....t Commentary&newsletterid=1225&menugroup=Home
leovirgo
Senior member
- Messages
- 3,161
- Likes
- 156
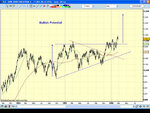
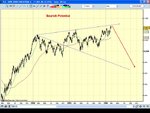
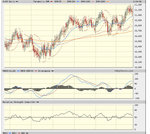
Share magazine's 'The Chartist' has already started talking about DOW potentially moving above 11,700 during this year. Technical reason is a big bullish triangle formed over 2004-2005. It is inevitable that the mass-based greed will end with a big correction at some stage, however, no one can be certain as to where the 'top' will be. For that reason I present two options- one for the bulls and the other for the bears. Having said that the market may move in an entirely different route!
Attachments
The problem with the bull triangle breakout is the massive divergence forming on MACD and RSI on weekly and daily charts.
Never known divergence like this to fail - of course now that I am loaded up to the hilt it's gonna go horribly wrong.
Of course, it could just turn out to be a correction down to 10,600 levels before a rise up to whatever but we will see a drop. I just hope it's from here and not much higher 🙁
Time will tell.
Attachments
Last edited:
Bigbusiness
Experienced member
- Messages
- 1,408
- Likes
- 23
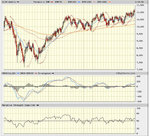
Bigbusiness said:This upside down chart of the DJIA weekly for the past 3 years caught my eye. It doesn't look too bullish to me. I wouldn't feel comfortable buying this, so I am not going short at the moment.
this view is interesting. but weekly chart is for long term.
Similar threads
- Replies
- 3
- Views
- 2K

