You are using an out of date browser. It may not display this or other websites correctly.
You should upgrade or use an alternative browser.
You should upgrade or use an alternative browser.
FetteredChinos
Veteren member
- Messages
- 3,897
- Likes
- 40
morning all guys...
looks like im the only one trying a long from here..
long 12270..
if we get back to 12,300, then that is a classic Oops buy signal.
reckon this is an obvious bear trap, personally.. shorts beware.
fc
looks like im the only one trying a long from here..
long 12270..
if we get back to 12,300, then that is a classic Oops buy signal.
reckon this is an obvious bear trap, personally.. shorts beware.
fc
FetteredChinos
Veteren member
- Messages
- 3,897
- Likes
- 40
I reckon the FTSE might well have a stab at closing positive for the day...
might be worth a binary..
might be worth a binary..
andycan
Established member
- Messages
- 630
- Likes
- 28
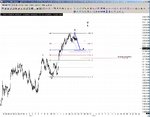
BezBez said:Remember this INDU chart of the possible W4...
I be careful of the mischief mark down accumulation phase before the Black friday results come in :?:
The W4 count is "pete tong" just below the 12200 level.
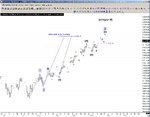
all i see is an ABC on your time frame
the larger time frame has priority
this is the 5th of a 5th if that makes sense
it could be a fake out as it stands, maybe even test the high but today unlikely
but what do i know
FetteredChinos said:I reckon the FTSE might well have a stab at closing positive for the day...
might be worth a binary..
Yep got a nice slice of that soooo cheap!
Cheers FC
I agree andy i'll go either way 🙂
I don't take a fixed view, I just go with what the odds favour, at the the moment the odds on my barmy stuff lean to more up side than down based pattern and Delta. I have a clear lines in the sand that shout out if i'm pete tong or a turns come in early...🙂
I only do higher frame stuff for a little gray matter exercise, as I'm just a simple day trader 😱 🙂
Still would like to see a chart of what your seeing though if you get chance....
andycan
Established member
- Messages
- 630
- Likes
- 28
missed this postBez said:Stick a chart up andy if you get chance so I can see what you mean ??
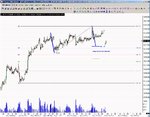
The ES is very techical market today opening in on its last Alternate correction ..
A good example on not to sell a gap open into techincal support 🙂
yes i sold before the open so caught most of the move down
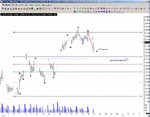
looking for an entry to short will try a small short here at 1407
stop 1409.75 and see what happens
andycan
Established member
- Messages
- 630
- Likes
- 28
😱 😱Hook Shot said:What 's the odds that Mr Can is short es here ????? Am I reading you Mr Can .?
Oh dear Andy's gone
you too sharp!!
andycan said:looking for an entry to short will try a small short here at 1407
stop 1409.75 and see what happens
Gap with a 61.8% should yield a few checky scalp ticks 🙂
andycan said:😱 😱
you too sharp!!
When I'm as sharp as you I'll have reason to celebrate.... When we're as sharp as RACER well one step at a time 😀
Similar threads
- Replies
- 3
- Views
- 2K


