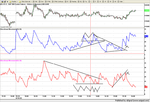
DMI Indicator

Fine,
my concern was that relatively inexperienced users would jump on this as a money generator, without realising there's a bit more to it than watching two lines cross. Being experienced you'll be putting that prior knowledge in, almost unconsciously, that newbies can't call on.
I use ADX myself, but in a different setting - using it to attempt to confirm trending behaviour to avoid whipsaws, notably in the Parabolic-SAR. Distinct similarities exist, I also use the DI/DM info to decide if the trend is going the right way as part of the test - I use a lower value than normal for ADX as a 'possible trend in place' down at 12 (14 day EMAs all round), plus the ADX has to be rising, plus the direction info has to match the trade direction. This isn't intended to pick 'good' PSAR signals, but to reject the bad ones.
 
Confused

Hittfeld said:
Hi nyc-hotshot!

Your very informative and widely applauded thread

http://www.elitetrader.com/vb/showthread.php?s=&threadid=21376&perpage=6&pagenumber=1

left some questions open. Would you mind to kindly answer??

Thanks

Hittfeld

It has seemed a bit strange that Bigtimetrader on this thread and Nyc-Hotshot on elitetrader make most of the same claims in very much the same words and style. :confused:


If they are not the same person, why would Bigtimetrader be plagiarising the work of Hotshot. If they are the same person, it seems odd that Hotshot should bother to start the same thread all over again, under the name of Bigtime, when the elitetrader thread is alive and well on page 50! Actually, Hotshot has said on the elite board that he doesn't post there that much anymore because of negative comment, but so far I don't think that either Bigtime or Hotshot has definitively clarified their relationship!

It would be interesting to know why there has been no reply by Bigtime or Hotshot to the post on this board by Hittfield. The questions that remain open on elite mainly have to do with the difficulties that elite participants have had in replicating (a) the charts and (b) the good results claimed for the system. It appears that participants who have attempted to replicate the system in Wealthlab or Tradestation have come up with relatively low win ratios.
 
I would be rather surprised to see this work (on its own) as well as has been claimed
 
Rognvald said:
I would be rather surprised to see this work (on its own) as well as has been claimed

Never claimed it would definitely work for anyone else. However, there is no doubt that it works for me. This is not a stand alone type of indicator there must be some other parameters like stock price and futures movements especially in the exits. These determinations are made very quickly and are second nature to me because I have been doing this so long.

If DMI/ADX helps you great, if not that's fine too. Perhaps it can be another factor or help in someone's strategy. All traders really need to develop their own stretegy, what works for one may or may not work for another trader. I am not telling you what to do, just offering some insight into what I do. Your all big boys/girls and can decide for yourselves what indicators and methods are best for you. I wish you all luck in developing your own methods.

BTW: I certainly hope nobody comes to these boards thinking that one post or thread will part the clouds and automatically make them a profitable trader. Unfortunately it is not that easy, if it were everybody would be profitable (which obviously they are not).
 
Bigtimetrader:
I concur 100% that gaining .01 to .05 cents per share is a very feasible way of making money. I daytrade almost exclusively stocks under 1.00 per share and try to buy in 3000 to 10,000 share blocks. I also trade the emini's. Look at it this way: 10,000 shares with a .04 move is 400.00 U.S. dollars. I have a system that I use to daytrade/swingtrade the pennies and have done good. I use the same system for the emini's. A small move in a penny stock is a completely feasible way requiring low capitol outlay and a high rate of return on capitol invested! But you need a system with a high win rate and you have to follow the system. Much like you have your system and it works for you. My system works for me! People probally think I am crazy daytrading pennies but hey, it works for me! Of course, I trade the emini's too but still do alot of trading in penny stocks.

bigtimetrader said:
I average between $500 - 1000 per day trading with the DMI/ADX (Directional Movement Index/ Average Directional Index) through the DAS PRO software.

DMI/ADX works for any trading style from day trading to swing or position trading. I combine the ADX/DMI onto one study. DMI is actually made up of 2 sub indexes the PDI (Plus Directional Index) and the MDI (Minus Directional Index). I make the ADX line white in color, the PDI line red, and the MDI line green. The DAS software makes it easy because it already combines ADX/DMI into one study. Although, I'm pretty sure most softwares out there also have DMI/ADX (it's very common), I think it's easiest to use and understand when they are combined on one study.

This is how I do it:
When white (ADX) crosses the other lines and is at the top and green (MDI) is at the bottom (red in the middle), it's a buy. White on top red (PDI) on the bottom (green in the middle), it's a sell. Often the simplest things work best and this seems simple and it is, but it works very good. I consistently make between .02 -.05 cents on 2000 - 5000 share trades. I usually go for more around the open (maybe .05-.10 or more). I ONLY trade widely traded Nasdaq stocks, like CSCO and INTC. I use 1 minute and 3 minute intraday charts to day trade. As I said it can also work for swing trading if you use a longer time frame chart.

You can try this theory out by going to the http://www.realfasttrader.com website and using their "free simulator", which lets you try the DAS PRO software free for a week. Test the DMI like I stated above, it has been working GREAT for me for several years now.

If you have any questions, post them and I will try to answer.
 
Last edited:
I use the DMI a great deal. I look for change of market perception.

For instance, we are in an up trend that is running out of steam and looks like it will turn south.
What actually is going on at just before and during this turning point.

1). The buying dries up.
2). Selling takes over.

I use a two minute ADX on the emini. I seperate the buy and sell line and show no DMI as I don't see the point of identifying a strong on weak trend on such a short time frame. I do use a full DMI on my 5. 10 and daily charts.
 

Attachments

  • Dow 5min412.png
    Dow 5min412.png
    97.6 KB · Views: 699
Last edited:
where is the ID for das software?

bigtimetrader said:
If you have any questions, post them and I will try to answer.

Sorry for stupid question, I loaded the Das Pro it asks for ID, if I go to get ID it takes me to a page with no mention of ID and password, how do I get the key?
 
Last edited by a moderator:
I am building a system relying on DMI Cross + ADX >=20 but am not sure abt the exit rule.

How about exit when EMA 3 cross above/below EMA 10?

Comments please

Thx:)
 
You don't have to insult people. I didn't start a new thread , this maybe not a quality "veteran" post but is it wrong to ask this question ? Isn't forum is about helping each other? Well since I am still a newbie , I often ask questions.

I was a computer tech guy , was active in a mailing list and replied to many newbie questions and don't insult people. I am not mad when I see people post newbie questions . What's the point of getting mad?. It's not that they comitted crime, kill or cheat people. You must be a very hot headed person, just a trivial issue like this makes you mad.

Time to go to a newbie trading forum .. this forum is full with arrogant "experts" who are not tolerant to newbies.
 
Last edited:
I have been looking at the DMI is Tradestation 2000i and it is setup the same as you have described in DAS PRO so includes the ADX. I will have a look at it during the next week. Do you also use Level II ?


I use DMI in Forex trading. Know of any alerts used with this indicator? One with sound would be great.
 
Looks like OP has abandoned this Thread, I got in late on this thread,to be able to ask any question ....sigh.Anyway, very interesting, I read thru' all the pages, and just fascinates me, something can be that "simple" and works consistently for OP.
 
The trouble with ALL indicators in my humble experience is they give to many FALSE SIGNALS. After several months trying different combinations it becomes a MAJOR research field ... and the piped piper of stock markets leads you to PRICE, VOLUME, HIGHS, LOWS and TIME.
 
I agree with the last post. You can build a strategy with say an Oscillator and the DMI but there will always be false signals. To minimise this problem, you can use multi time frame analysis. You still get false signals but not as many.

Time is an interesting subject. I do look at Weekly and Daily time frames as part of a top down approach but when it comes to intra day I view gap charts off a 5 minute time frame but my trading is off charts where each candle has the same volume. These charts for me have more meaning and look a lot smoother.
 
I average between $500 - 1000 per day trading with the DMI/ADX (Directional Movement Index/ Average Directional Index) through the DAS PRO software.

DMI/ADX works for any trading style from day trading to swing or position trading. I combine the ADX/DMI onto one study. DMI is actually made up of 2 sub indexes the PDI (Plus Directional Index) and the MDI (Minus Directional Index). I make the ADX line white in color, the PDI line red, and the MDI line green. The DAS software makes it easy because it already combines ADX/DMI into one study. Although, I'm pretty sure most softwares out there also have DMI/ADX (it's very common), I think it's easiest to use and understand when they are combined on one study.

This is how I do it:
When white (ADX) crosses the other lines and is at the top and green (MDI) is at the bottom (red in the middle), it's a buy. White on top red (PDI) on the bottom (green in the middle), it's a sell. Often the simplest things work best and this seems simple and it is, but it works very good. I consistently make between .02 -.05 cents on 2000 - 5000 share trades. I usually go for more around the open (maybe .05-.10 or more). I ONLY trade widely traded Nasdaq stocks, like CSCO and INTC. I use 1 minute and 3 minute intraday charts to day trade. As I said it can also work for swing trading if you use a longer time frame chart.

You can try this theory out by going to the http://www.realfasttrader.com website and using their "free simulator", which lets you try the DAS PRO software free for a week. Test the DMI like I stated above, it has been working GREAT for me for several years now.

If you have any questions, post them and I will try to answer.

Hello, I am joe and am new to this post. I have been looking for a trading platform . Checking out a few as I write. I did as you suggested realfast and now fidelity, schawb, MBT but no clear winner yet. My question is do you place market or limit orders???? I am looking at CCI as a confirmation on the sell side especially as it crosses the ADX (this dosen't always happen) that usually gets me out before the price breaks the upper bollinger band. What do you look for on the three minute chart to confirm your buys?? I trade the indicators set on 5 periods. It appears to follow the price swings more closely. I only trade stocks that have gapped up with million share volumns or have a daily strong uptrend in place due to favorable news. This way if I have to eat cake I can lick the icing later. I agree with your assesment about morning trends . They are usually more profitable. Do you use trailing stops?? Did you trade during the market meltdown?? Using the Nasdaq futures trend must have kept you out of the market many days???

Thanks for your post.
CJ
 
I am using a 15 smooth period currently. Although I have at different times had it set anywhere from 12 to 15.

PS: DMI made a few nice calls in CSCO today, from .05 - .10 (plus several smaller moves).

Hi bigtimetrader,
You mentioned how to enter the trade, but did not mention how and when to exit or set stoploss, can you give some explanation?
 
Top