You are using an out of date browser. It may not display this or other websites correctly.
You should upgrade or use an alternative browser.
You should upgrade or use an alternative browser.
Yea - Ive ditched cbrl. Nothing happening today. It fell Thurs after falling short of earnings expectations. When this happens stocks often consolidate for a bit - TA bears selling to the fundamentals who see a bargain at the price.
My long is doing well (sina) but Im expecting a sell off towards the close.
How large is the watchlist? Ive narrowed mine down to around 70 - all with a beta > 1. I then look at the hourly charts for entry if trading the hourly bars, or the daily for 5 min entries (as I m doing today) Im only watching 5-10 a day though. I may make several entries though when doing a 5 min chart.
Hi BBB
My watchlist is work in progress with around 15 stocks. I intend to get it to between 30 - 50 in order to generate around 5 potential plays either side per day.
I use a similar strategy as the one for the DAX, but on a daily basis in relation with 50 and 200sma. Entry is above/below previous days high/low.
Both GENZ & KLAC didn't perform today, but their not in danger of stopping out. Holding time can be couple of days to couple of weeks.
I'll run the scan after 9 tonight and let you know what fruits it bares
Cheers
Results of Scan for Tuesday
AMZN buy above 42.30 with stop at 41.17 for possible $1.50 move
LNCR buy above 34.95 with stop at 34.36 for possible $1 move
ADI sell below 47.85 with stop at 48.76 for possible $1 - 1.50 move
Let's see how these make out tomorrow
Cheers
AMZN buy above 42.30 with stop at 41.17 for possible $1.50 move
LNCR buy above 34.95 with stop at 34.36 for possible $1 move
ADI sell below 47.85 with stop at 48.76 for possible $1 - 1.50 move
Let's see how these make out tomorrow
Cheers
cd, this is how I see Dax. I agree in hindsight its fine but it might give you something to look at.
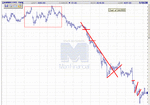
Initially on the daily chart below, we broke violently lower and have since retraced approx 50% and run out of steam with a number of similar length bars. I would be looking for the next move down and would be wary of a break to new (week - 2 week) lows.
On the 2 min chart I have tried to show how I see things. The rectangle is difficult to trade, I think you either sell new highs or buy new lows but its not easy. I have then included horizontal lines which I think are areas where I would either be selling the bounce (so sit on offer) or more likely hitting bids as we break lower. Today is an extreme day as there is a big violent move without much retracement (ie trendline). When this breaks I would look to see if its likely to go lower or not and sell each break of my red line.
Hope this helps and feel free to ask questions.
Attachments
Similar threads
- Replies
- 1
- Views
- 1K
- Replies
- 27
- Views
- 15K


