Day trading the DOW 24/03/03

Dunno the answer here guys.... I did change one chart to 2 min/50 ema to maintain the correct ema profile..... I cant say I recall changing it back so maybe that's it. The other way discrepancies can come in is the start and end time of charts. I know there are differences in Lycos for example.... Sierra rolls back the EMA as if it were contiguous with yesterday's data. Lycos starts with fresh data at the open ( I think)...
PS I've just checked my charts at work and you're correct! Last night's DOW has the EMA still set at 50. Just goes to show that it's not really that important what the setting is :) ie previous reference to do I use the EMA on the closing prices. Others swear by SMA. At the end of the day, find something that you understand fully, stick to it, and learn the characteristics of it'd behaviour. The same argument applies to RSI and CCI settings, and any other indicators you may use. These things are not cast in stone.
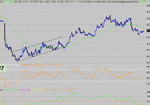
For reference, here is the correct EMA on the DOW....
 

Attachments

  • dow.gif
    dow.gif
    17.5 KB · Views: 592
Chartman, thanks for a brilliant set of posts. My TA skills have improved greatly as a direct result of your contribution to this board.

One thing I still struggle with is the setting of targets for bull & bear flags. To get the target figure correct it is essential to know where the flag pole starts, but this start point does not always seem obvious to me.

In the 1 min DOW chart you posted above there are two flags, one seems to have an obvious start point, in the other it is less clear to me where the start point is.

Can you shed any further light on this.

Dino.
 
Dino- I've edited the chart to show the correct target. No wonder you couldn't work it out! Well spotted . Take a bonus point :)
Well done on your efforts. Nice to get feedback saying how people are improving.
 
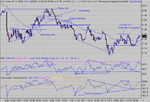
Difficult start again today with a pot luck entry... IF you shorted at a top , your losses would be minimal. If you shorted at one of the bottoms , then I guess you took a hit. :( (I tried a bit of each and failed.) The long pick was fairly easy with a couple of enrty points around 8170. Again, this could well have been a fruitless trade unless you had the witts about you to see the double /tripple top . An exit in the area it says "short entry" would have been just in profit. The safe short entry soon followed....at around 8180 again, as support failed and on the 100 MA pullback. There were in fact quite a few entries around here, all within 10 points or so, so no real harm in playing the "wait for a safe entry". No need to get panicked into entries, it's rarely worth the risk....
Note the HOR. 8170 line changing from resistance to support and back to resistance. As if you needed any more confirmation, there was a H&S as well. ( target 8162)
Look at the chart and see the "magic 8164 line"........ This was also resistance/support/resistance, as was 8132.
Picking a bottom was not clear cut.... There was divergence across 17:50 to 19:30.... and there a "W" bottom formed. The bar rising through 8126 was the exit signal at 19:46. Staying in for the 100MA real play would have taken you to the close. Before that, there was another exit clue from the last double top with divergence, giving an exit around 8130 @ 20:36.
Not an easy day, and 50 to 100 points were about all one could squeeze out......
 

Attachments

  • dow 28-03-03 1 mina.gif
    dow 28-03-03 1 mina.gif
    24 KB · Views: 515
Yeah, same here Chartman, once again thanks for all your effort. My ability to interpret the Dow has come on 'leaps and bounds', and it's all your fault ! :cheesy:

CHEERS!
 
thanks chartman for another very interesting week......am i right in saying that you are using the AIQ / mytrack charting package?

also why do you trade the dow rather than s&p? what do you see as the advantages of one over the other?

ed crane
 
Was this a fairly tight day range for the dow? It looks about 95 points or so; I can't measure it properly as I'm away from my home PC.

If we do have a narrow H-L range could this mean a larger move may take place next weak?


Thanks for the posts Chartman.
Best Regards,
Neil
 
Jesse, Guesty, Ed and Bansir. Thx for the comments.
ED- I used to use AIQ, now I use Seirra Charts (www.sierrachart.com) much cheaper as I don't do any EOD stuff anymore. + MyTrack feed.

I do trade the S&P Futs.... and when I feel greedy I trade the DOW. 6 of one, half a doz of the other..... but I find the S&P less wild in its bias than dow so I prefer the S&P. I also trade the S&P premarket.

Bansir- check out NR7 info - there are theories that say after a 7 day period of narrow range trading, one can expect some volatility. I'll take a pass on that. If the move is big, I cash in big. If it isn't , too bad. Same story as news really, just trade what you see. You never know how big ( or small) a move is going to be until it's all over.........
 
Hi,

Thanks for all the commentary - its very helpful. I think I have just about got the entry signals sorted. I got the long at 15:49 and then the short at 16:52. However, my problem is that I panic once in a position and can't get the close right and often end up losing because I close the position on a minor reversal. For example, I closed the 15:49 at 16:05 and the 16:52 at 18:23. Very frustrating after spotting the entry!

Any advice or help on how to avoid falling into this trap of closing in minor reversals much appreciated.

Also, I am finding that the D4F prices are often considerably off the actual DJI and so makes it even harder to make money. At one point it was boucing +-20 points while DJI wasn't moving. I also have an account with Finspreads but tend not to use it because I prefer the D4F software - are Finspreads better or worse for the bias?

Thanks,
Chris
 
Hi Chris,

I have the same problem with Deal4free. Chartman did say earlier to ignore the spreadbet quotes and just concentrate on the index chart. Easier said than done but it should help.

Finspreads have a slightly higher spread than Deal4free and when you press the deal button, the qoute is usually quite close to the Deal4free quote. I sometimes have both accounts open to compare the quotes.

Deal4free base their quotes on the futures price and on Friday it was darting around on low volume, war news and rumors. I also noticed this pattern on the 15min chart that seemed to be causing a bit of volatility.
 

Attachments

  • 28.3.03.gif
    28.3.03.gif
    6.1 KB · Views: 358
ChrisGee - I can make a suggestion here- it may not be the final answer, but it should help.... I don't know what your stake size is , but try halving it and set your mental stop to twice the size.... Same net loss. This may help you relax a bit more when the situation looks like terminally going in the other direction. It takes a lot of faith trying to trade someone elses system and continually worrying about if it's going to work out..... It helps as well if you're not doing this for a living.....
Reducing my stake size made a huge difference to my trading. I was basically risking far too high a percentage of my capital and was doing just what you did- exiting on fear or uncertainty.
As time passes , you will all develop the required skills to enter and exit trades at far better positions whilst still retaining the basic strategies shown here to manage your trades to the optimum. Remeber, you won't always be right, but being more right than wrong will bring handsome profits by way of enhanced Reward/Risk ratios.
 
Hi,

Thanks for the responses. I am only doing £1 a point at the moment to practice and develop a feel for various approaches and try and gain the confidence! But I am trying to imagine what I would do if I had a bigger stake. There is a huge amount of psychology you need to get to grips with as well as the TA!

Specifically on the two trades I made on Friday was there anything obvious that I was missing that would indicate the gain would run till 16:30 and then the fall would run till 19:30.

What stops do people normally work with?

Thanks,
Chris
 
ChrisGee and others.
Yes there was , but in a negative sense. I have found that (mostly) a bottom and a top has a clearly defined TA form, either by way of Positive or Negative divergence across 3 troughs/peaks or an H&S ( or Inv.). Another bottom formation is te "W" , an example at 19:25 to 19:53 on Friday. In my experience, and worth noting, is that real tops and bottoms, as opposed to pauses etc., tend to take at least 30 mins to develop.
So a double bottom across 15 mins would tend to be a local pause as opposed to the bottom of the trend.
It is an important part of DOW TA to recognise these timescales. please be aware, as I've said before, nothing in TA is cast in stone, but you do have finite rules on which to base decisions to improve your position, be it a close or a continuation.
I still say try reducing your stake, maybe 50p, whilst you gain confidence in the strategy and analysis. Once you have the confidence in determining the likely outcome of any TA, you will find that the £££ attached to the trade will ( hopefully) be insignificant and NOT affect your TA decision making. Your trading will be purely based on TA and NOT by the fear of losing money.
 
A couple of people on this thread have compared Finspread and D4F. I too prefer the D4F software. I use D4F for trading UK stocks but are using FINS to trade the DOW as I can't find the DOW on the D4F instrument tree, only the NASDAQ & the S&P - am I being a complete dumbo ?

Dino
 
Thanks guys.

I was searching for the word DOW and I also had a mental aberration that the DOW contained 100 stocks not 30, so thought the US 30 was a different instrument - doh.

I feel ever so humbled - I guess we can all have a bad hair day.

Dino.
 
On some feeds you'll see the Dow also referred to as INDU (short for Industrials) and/or DJI (short for Dow Jones Industrials).

So it is not always straightforward in finding 'the Dow' on feeds. :(
 
Top