Day Trade the FTSE

entries and exits

I read somewhere that the majority of inexperienced traders loose money or dont make as much as they should oin a trade because although they enter a trade on the right side of the market, they are taken out, either by their stop being too close or by getting out too soon before the price move is finished-
 
trooper said:
I read somewhere that the majority of inexperienced traders loose money or dont make as much as they should oin a trade because although they enter a trade on the right side of the market, they are taken out, either by their stop being too close or by getting out too soon before the price move is finished-

It's b---------- difficult! If the stop is in the right place, then the closer the better. However, where is the right place?

Split
 
Splitlink said:
It's b---------- difficult! If the stop is in the right place, then the closer the better. However, where is the right place?

Split

The stop should be somewhere that would negate the set up that got you into the trade in the first place, and wider than the average volatility. It should also not risk more than 2%of your trading account. All in all, one of the most difficult decisions
 
Tricky week

Well we've come to the end of a tricky week on the ftse , although the index has climbed over 100 points, a lot of the gains have been at the gap up, and left us traders with not a lot toi chew on. Nonetheless, we have managed to keep a trickle of income coming in hoping for better timnes ahead. The INtraday volatility, the life blood of a day trader has been very poor, with several days, after the initial gap up confined to a narrow 20 point range for most of the time. I cant say I have high hopes for next week, as the last week before christmas. Nonetheless, US markets have been steaming ahead..so now that the ftse it back to its previous highs, it'll be interesting to see if it can break through.
 
Revival

I thought it was time to revive this thread. (call me a masochist, but then all traders are to some extent! :D ) after the last week or 2, the ftse has at last given us a few days this week with decent volatility, and a chance to get a good bite out of the 40-50 point trends. Here's my 360 tick chart..some of you old timers will remember this quirk of mine.

While trying to persuade/cajole/motivate my daughter to do her piano practice this evening, it occurred to me that trading is very much like playing the piano. When you first start to learn, its as much as you can do to read a few notes and play them with one finger. As time goes by with plenty of practice, you start to get a feel for the notes on the page, and when you achieve competence at a piece, the true expression of the music only comes when you stop thinking about the notes and play from the subconscious, or the "inner Brain, as trading coaches like to call it.

I confess to still being at the one finger each hand stage when it comes to trading, but with patience and practice, making modest progress.
 

Attachments

  • Z23-2.JPG
    Z23-2.JPG
    60.9 KB · Views: 197
p1

datav said:
I thought it was time to revive this thread. (call me a masochist, but then all traders are to some extent! :D ) after the last week or 2, the ftse has at last given us a few days this week with decent volatility, and a chance to get a good bite out of the 40-50 point trends. Here's my 360 tick chart..some of you old timers will remember this quirk of mine.

...........with patience and practice, making modest progress.

hard-workin' chap, welcome back..........makes two of us

Ive been trialling a simple end of day diary format recently that has worked very well to bring out some trading foibles.........this is a simple one-minute summation of the instruments traded on that day as, I find, speaking outloud a very easy way to jog the brain on important matters that don't get interrupted by my old English-teacher giving me a hard time about punction n' stuff :)

this is a trial upload of the video and I am in the middle of the text........although the chart is hindsight there's still alot to learn, much of which I won't cover and some of which I do that very useful (to me) for your consideration...........

again, this is a trial so there maybe relevant stuff omitted which we can go over on the phone and if the mods give it the nod then maybe a journal or something similar could be resumed.............back in mo with p2

erm; punkchuashun spelt punctuation :|
 

Attachments

  • Replay Screencast 2007-02-24-19.26.wmv
    2.8 MB · Views: 240
Last edited:
p2 ziggy

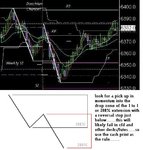
in the down phase the game appears simple enough so am talking from the pov of the chart as presented although I'd want to go further back to get the "look" of previous influences, to see who's done what, where and who agreed to go to the party

........you need to look for the one-to-one ratio in these simple zigzags.......although you do not know that you are witnessing the one to one ratio or the simple zigzag as it unfurls, you should look further back for the retracement target to find the support and then place a grid over the chart looking for the extension the same way you would with a Fibonacci extension........so you are seeing a simple ABC where the C wave is weaker than the A wave* ...........this is also borne out by the weaker and higher low in the stochastic........the C wave is also a classic 5 in Elliotts work........very clean, whereas the A wave a is a simple 3........this is a very god clue about the intention of the smart money........you see, despite what you hear about the power of smart money only one of two things can happen, ever do happen, in my experience and that is ; price is accepted, or not, no matter how it is presented.......this , for me, proves Elliotts works........that's all by-the-by........the point is to look for the ratios as they unfurl.........now ratios are a subjective area of technique and most trader get this hit and miss .......work one trade and not the next.........ratios merely reflect extent of price acceptance and note that this is also based on "that specialists rarely look at charts" so they too must have memory of where price likely to go........my point being that there is no manipulation as such, there is only reach by presentation........the ratios merely reflect the extent of that reach..........this is a fine balance of linear thinking about the chart and thinking about who attempting to do what at what time and at what price level.......not all players are going to engage at the same price level(s) including the time of the day or week or month........this is very easy to appear as though I am being generallisitc at one moment and then precision the next.......I am merely attempting to (re)tell what the market is doing from both players points of view****

now that you have taken the long pos at 6352 area (based on the candle config) the next natural upside res is at the start of the previous C wave...............so you look at the final bars where the price is tapped, as far as possible, from the traders who are in-trade at that time, that is, the most influential captial in action versus the most scared and easily bullied small (but not insubstantial from a market health pov) that'll tend to vary depending on the time of the year but basically the game appears the same and not entirely dependant upon the players always being the same.....just the approach........hence patterns repeat and there actions have validity if you choose to see and use that reccurrence.


*(A waves carry the strength but the C wave carries the conviction........more on that later)

** (the final three bars will have less volume and in the lower degree you'll notice much more relative weakness although the momentum is likely to actually increase in many cases as the capitulation is printed........price print is merely a reflection of the emotional "what-if" being realised until a new print shows who got sucked into the psycho vortex.........more on that later too)

*** this is arguable from the (lone) pov that not every buyer has a seller as some buyers have several sellers etc.......
 
p3

......... think of the ratio like youre travelling behind a fast car and you're approaching the traffic lights........the only thing you're looking for is three things, the lights to change to amber the slowing of momentum in the car in front and the application of break-lights.......the lights change but the break-lights and you detect an increase in the cars speed.......but suddenly the other driver applies the breaks after accelerating the car........strange thing to do but it tells you about the psycho that the driver just went through........price is similar and by looking for the ratios (combined with all the other data and your ideas about market participants) then I think that the ratio work is very handy to place into practise although you'll need to develop the knowledge so as not to get distracted by the work of the application.....again, as you say, like the piano.........perfect practice makes perfect..........

for anyone else who is new to this thread I would recommend reading work by Dbphoenix and mr.marcus at T2W . I thank them for past contributions.

sinnerggistik........err synahjystic.......erm synergis.......buggah
 

Attachments

  • datav 1 to 1.JPG
    datav 1 to 1.JPG
    49.9 KB · Views: 198
Last edited:
  • Like
Reactions: Bez
Great post Joules, and what a great idea topost a video. I'll organise a tick replay video, so that we can so how your ideas play out in a live trading scenario. There are so many ways to skin this cat...trade support and resistance, trade fibs, trade measured moves, trade stochastic trade Elliot, my view is that a trader has to try to choose a few things that he/she believes in and trusts. The great obstacle to trading success is confidence.."is my plan going to work?", "shall I/shant I "...oh SH** its going the way I thought, better get in...oh no, its turning, better get out... etc etc etc

Plan the trade, trade the plan....how many times have we heard this. That is the crux of it, know enough to have faith in what you want to do, and the balls to do it
 
There is whiff of test and perhaps break of 12350-60 dow cash........ if that pans out then the rally should start in Europe and ftse looks attractively priced although it's a long way to 6230-40!

Downside is easy to call so I must allow for possibility that we go North.....

If US rally starts in Europe ...there should be easy money to be made as last check ftse was only called up 11-15pts...

Good Trading
 
Movin' on ........

Puzzling that Ftse is still 100 points above the recent swing lows at 6000(based on Spreadies quotes) ............given that US is so weak...
Not sure what to make of it... since Dx is also well above it's recent swing lows...
Maybe the slide today in US is not real ....... and we may get overnight rally... in US futures... that's the only way that the disparity makes sense (to ME).

STATTO point
Ftse hit recovery highs at 6276 on 12 March (4yr anniversary of the UK bear market lows)
.
Many will remember the lows that day in 2k3 at 3277 right @ the close of uk trade....
 
Hook Shot said:
Movin' on ........

Puzzling that Ftse is still 100 points above the recent swing lows at 6000(based on Spreadies quotes) ............given that US is so weak...
Not sure what to make of it... since Dx is also well above it's recent swing lows...
Maybe the slide today in US is not real ....... and we may get overnight rally... in US futures... that's the only way that the disparity makes sense (to ME).

STATTO point
Ftse hit recovery highs at 6276 on 12 March (4yr anniversary of the UK bear market lows)
.
Many will remember the lows that day in 2k3 at 3277 right @ the close of uk trade....
Our old friend "Heavy oil weighting" perhaps????
 
Hook Shot said:
Possibly......... :eek:

When FTSE was trading 6000 and Dax was down at 6450 ish on that Monday 5th the Dow futures were trading down at 11960 pre open.

cheers
 
2468steve said:
When FTSE was trading 6000 and Dax was down at 6450 ish on that Monday 5th the Dow futures were trading down at 11960 pre open.

cheers

Thanks Steve......I'd totally forgotten.... the numbers make a bit more sense now :)
 
Hook Shot said:
Movin' on ........


STATTO point
Ftse hit recovery highs at 6276 on 12 March (4yr anniversary of the UK bear market lows)
.
Many will remember the lows that day in 2k3 at 3277 right @ the close of uk trade....

remember the alamo..........erm, I mean, remember the sentiment, the intentional oversell to rebuy, exhaust the small buyers and at a time when the us was making a secondary low........at a time when every pundit, mug and guru was foracsting end of thew world..........just yesterdy I watched as 3 wannabe know-its lambasted Terri from Eastman (in a segmant entitled; the bulls)who said.......you aint seen nothing yet, the decline has only just begun............ and the cnbc wally (drunkard) who lambasted that peter bloke for being too bearish (with real numbers) and the drunkard said how cheap the dow value was relative to gold and hadnt we seen all this before.........and yadda, yadda amazing yadda........well, you pillock, cnbc arrogant , little weeny-puny-chap.......it's about to get a lot cheaper.........and pete can come back and say; told you so which I know he won't...........so sentiment..........when you can't lose, coz its a bull market, then everyone (tthe small folks) are all-in, all hands are to one side of the boat..........at the bottom of the may 06 drop the sentiment took a good swing........recently we've been at record highs in sentiment so some squeezing of the long hands is being done so the pros can get better value below.........

:p
 
Joules MM1 said:
remember the alamo..........erm, I mean, remember the sentiment, the intentional oversell to rebuy, exhaust the small buyers and at a time when the us was making a secondary low........at a time when every pundit, mug and guru was foracsting end of thew world..........just yesterdy I watched as 3 wannabe know-its lambasted Terri from Eastman (in a segmant entitled; the bulls)who said.......you aint seen nothing yet, the decline has only just begun............ and the cnbc wally (drunkard) who lambasted that peter bloke for being too bearish (with real numbers) and the drunkard said how cheap the dow value was relative to gold and hadnt we seen all this before.........and yadda, yadda amazing yadda........well, you pillock, cnbc arrogant , little weeny-puny-chap.......it's about to get a lot cheaper.........and pete can come back and say; told you so which I know he won't...........so sentiment..........when you can't lose, coz its a bull market, then everyone (tthe small folks) are all-in, all hands are to one side of the boat..........at the bottom of the may 06 drop the sentiment took a good swing........recently we've been at record highs in sentiment so some squeezing of the long hands is being done so the pros can get better value below.........

:p


:) :)

Interesting times ahead, joulio
 
Top