Daily Dax

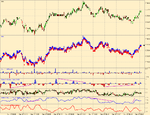
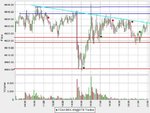
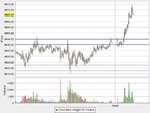
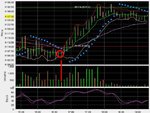
It seems that most here are not scalpers, but others might still find the attached DAX chart interesting. It is an attempt to provide tape reading info without staring at the DOM all day.

Each bar is just 5 ticks (from IB data feed, so the 'ticks' may be aggregated first by Eurex, and secondly by IB).

From top to bottom we have:

1. Ordinary price candlestick

2. Market Delta type chart where each price level is coloured according to the difference of contracts traded at ask to contracts traded at bid. This type of plot is generally more usefull for substantially longer bars - say 100 ticks or more.

3. 'Histogram' type chart showing above ratio for the bar.

4. Smoothed version of 3.

5. The interesting bit. The ratio of total contacts at ask at all five levels of the order book to total contracts at bid plus total contracts at ask (all levels). It is shown as an OHLC series plotted as candlestick.

6. Smoothed version of 5.

7. ATR of 5 - an attempt to show volatility in the order book.

I'm sure I'm not giving the game away to point out a few things here. (Successfull scaplers MUST know this stuff already).

The implications of the volume at bid/ volume at ask are fairly obvious.

The order book behavior though, is at least on first sight, counter intuitive. As a general principle, the market moves towards size (until it doesn't). A micro trend down for example is often terminated by a rapid change in the order book where size moves to the ask. Continuation of a micro trend down is indicated by size staying on the bid (but not necessarily on best bid).

The second observation about the book is that book volatility frequently precedes change in micro trend and lack of volatility indicates continuation of micro trend.

The attached chart is not an especially good example, as DAX wandered about in a fairly aimless range after todays open, but I think the main points are still clear.

I have observered this book behavior on DAX, ESTX50, ES, ER2, SGXNK and K200. Of course each market is different due to liquidity and volatility and quite possibly other factors.

I'd be really interested to hear comments, especially from scalpers. And no, I don't think it's the holy grail - support and resistance including pivots, market profile levels, vwap, 'obvious' S/R levels and volume need to be closely observed.
 

Attachments

  • dax_5ticks.png
    dax_5ticks.png
    30.4 KB · Views: 220
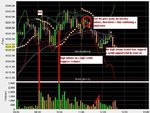
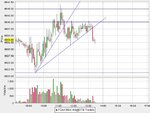
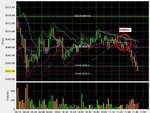
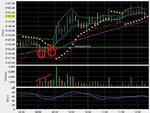
Here's a short setup this morning. Once again I'm too tired to trade, but there it is.
 

Attachments

  • dax5min.jpg
    dax5min.jpg
    77.2 KB · Views: 214
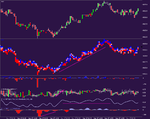
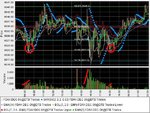
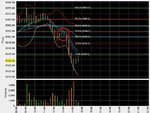
Here a second and better example - this time on a 10 tick chart. Notice how the up trend is maintained as long as size is on the ask side of the book.
 

Attachments

  • dax_10ticks.png
    dax_10ticks.png
    17.7 KB · Views: 203
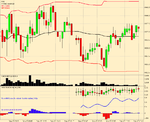
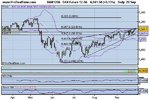
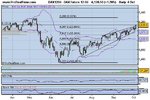
A final example. A DAX 5 min chart showing that the order book behavior is important over longer periods. There is tick and book data missing from this chart as I had to shut everything down during a severe thunderstorm. Also plotted on this chart are the bands described by Grey1, called I believe, MPD bands. They are calculated by VWAP +/- (HOD - LOD)/2. For days without strong trends they are often interesting levels for SIFs.
 

Attachments

  • dax_5min.png
    dax_5min.png
    20.3 KB · Views: 212
dcraig1 said:
It seems that most here are not scalpers, but others might still find the attached DAX chart interesting. It is an attempt to provide tape reading info without staring at the DOM all day.
8<

Thanks so much for these posts dcraig, I have been trying to figure out how to use the DOM to help me with my microtrading for a few months. It seems you have already found a good technique.

Could you expand on the precise details of your formula please.
 
Dax-ftse

To any of you DAX traders who are interested, we started a group to daytrade the FTSE using the T2W live chat room. Since both markets move in tandem, you might want to drop by. Seems we have it to ourselves in the morning. :LOL:
 
September 27 in review

My trade opportunities of yesterday
 

Attachments

  • dax2709review.JPG
    dax2709review.JPG
    62.7 KB · Views: 182
is the worm turning?

A couple of obvious doji buys on the chart today, and price also trading well into old areas of resistance. Noteworthy is the volume traded on yesterdays highs, which seem to have kept the bulls at bay today and produced another very narrow range, again probing down well below the close like "hanging man" candlesticks, but the top wicks make them dojis.

We should look tomorrow (Friday) for a lower open to signal a move down.
 

Attachments

  • dax5min.jpg
    dax5min.jpg
    89.5 KB · Views: 181
  • daxdaily.JPG
    daxdaily.JPG
    64.5 KB · Views: 191
Last edited:
daxdaytrader said:
A couple of obvious doji buys on the chart today, and price also trading well into old areas of resistance. Noteworthy is the volume traded on yesterdays highs, which seem to have kept the bulls at bay today and produced another very narrow range, again probing down well below the close like "hanging man" candlesticks, but the top wicks make them dojis.

We should look tomorrow (Friday) for a lower open to signal a move down.

Actually, I was totally bullish after yesterday evening and was expecting an outbreak after the NQ showed remarkable strength... It came up from after a SC to close near the high which was a new high for the last couple of weeks and months. I've looked at this situation a couple of times in backtesting and there's a big chance DAX will be opening with a breakaway gap. In fact, it just did.
 
yesterday's built-up

I think you can see some accumulation if you look at the day in review.
 

Attachments

  • daxbuiltup.jpg
    daxbuiltup.jpg
    53.6 KB · Views: 192
daxdaytrader said:
A couple of obvious doji buys on the chart today, and price also trading well into old areas of resistance. Noteworthy is the volume traded on yesterdays highs, which seem to have kept the bulls at bay today and produced another very narrow range, again probing down well below the close like "hanging man" candlesticks, but the top wicks make them dojis.

We should look tomorrow (Friday) for a lower open to signal a move down.

I wouldn't attribute so much meaning to the volume you indicated by red. Around 1530-1600 you have US opening which always means a big volume pump-up. Then after 1730 most are leaving and if you check volume at 1800 and compare at to any other time you'll find that in 90% of the cases dropping off. More interesting imo is the steady continuous upmove that started after 1800 on flat volume, which indicates no selling pressure to me.
 
It's one of those irritating days where the few minutes I take a break are where the market moves. As on prior days, looking for weak tops to short, and the key price area around 55 for a bigger move.
 

Attachments

  • dax2min.jpg
    dax2min.jpg
    71 KB · Views: 193
  • dax15min.jpg
    dax15min.jpg
    69.7 KB · Views: 168
firewalker99 said:
I wouldn't attribute so much meaning to the volume you indicated by red. Around 1530-1600 you have US opening which always means a big volume pump-up. 8<

There is nearly always some chop as the markets harmonise. On this day I felt that the price action was more volatile and the volumes greater than usual, and so worhty of highlighting. As you see I don't indicate any setups, and trading this period can be risky.

I think you are right about the rally that follows indicating weakness. Taken together, I think we did get a good indication that the current price was weak.
 
Last couple of days have seen some very strong moves upward continuing the trend.

Wednesday morning produced a couple of nice buy setups, and again a similar buy in the late afternoon, leading to a good move up, much as seen on Tuesday. These days seem to need a lot of patience as the day produces a lot less move than the evening.

Finally touching the tops of the channels, seeing some volume coming in and looking for a setup to sell this market. If so, will target to around 6090 and 6050.
 

Attachments

  • dailyday.JPG
    dailyday.JPG
    64.8 KB · Views: 238
Again today a quiet morning with a decent move later in the afternoon, just like the last few days. This setup has been working nicely on the 5 minute chart, look for weak lows and then a break of the SAR.
 

Attachments

  • dax5min.jpg
    dax5min.jpg
    72.9 KB · Views: 193
The bulls out early this morning with plenty of volume, and I had 3 goes to get in at a good price but ended up coming out a few points down, emotional capital had run out and too many distractions!

Anyway, here are the setups, just some of the usual suspects.
 

Attachments

  • dax5min.jpg
    dax5min.jpg
    72.1 KB · Views: 193
this sort of market can be quite dangerous imo with 20 points either way seemingly both quite
feasible.

Although generally the trend is still up.


any other posters out there...fancy offering an opinion..
on where we are going

Free cappaccino.. ok ok a virtual one :)
 
daxdaytrader said:
The bulls out early this morning with plenty of volume, and I had 3 goes to get in at a good price but ended up coming out a few points down, emotional capital had run out and too many distractions!

Anyway, here are the setups, just some of the usual suspects.

Do you micromanage your trades using 2min or 1min after entry. Wondering if your entry was around the circle marked, there was then a 20pt move, did you have your stops too close.
Which trading platform do yu employ .
 
Top