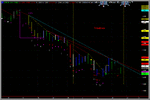
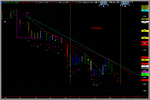
daily 4 cast signal

Wednesday June 8th 5:45pm EST
EUR/USD - MY GUESS FOR THE 9TH IS UP
EUR/JPY - MY GUESS FOR THE 9TH IS UP
GBP/USD - MY GUESS FOR THE 9TH IS UP
USD/JPY - MY SYSTEM FOR THE 9TH IS DOWN

this is for your entertainment only and it's my suggestion you not make a trade based on the above!
 
One note on the above - my TradeStation data comes from GFT forex & the day ends on my TS forex charts at 5pm EST here in USA. I have no idea why they do it that way but I then take the daily data OHLC and do some hand charts - yes i still hand chart. And the above guess'es are based on those hand drawn charts.
 
what a weird day in the markets
storm knocked out our power last nite for 6 hours & then today both RJOFX & TradeStation had problems

my guess above was off - not even close 🙁
 
Trading for 16/06/05 on EURUSD must make a low of 2070 or lower to avoid a confirmed buy signal.
 
I am a little late on my analysis tonight. But this is the question I ask every night when I draw my daily charts -

What did today tell me??? Sort of depends on what you look at - are you looking at what the market did between the open & close? Sure that's important, and is one factor. So the data we need is the OPEN & CLOSE. And lets make it visual by drawing a line from these two data points. Next consideration might be what did the LOW do today? Up from y'days LOW? or was it down? Make that your second data factor! The 3rd data factor is of course today's HIGH - was it higher or lower than y'day?

EUR/USD - the lows turned up, the high turned up and we narrowly missed a buy signal by 13 pips

GBP/USD - Confirmed buy signal the low really turned up as did the high. This is only the 2nd buy signal in the last 27TD's - this will end as an UP WEEK and should make a key reversal. After retreating nearly 1200 pips it's about time for a rally.

USD/JPY - I had an early warning sell signal 13/06 but so far no confirmation.

Tomorrow night or perhaps Saturday I will be looking at weekly data along with how the week ended so as to get some idea of direction for next week.
 
Eur/usd Weekly Chart

G'morning & TGIF

It's begining to look like y'day's near miss of a buy signal on EUR/USD leaves me a bit 😱

Throw up a weekly chart for you to see the bar count and how it worked in the past - my experience with bar counting is that bar 7,8, or 9 often mark a top/bottom. So far no painted bar signal - will be watching how the computer finishes the day/week.

Chart is done with TradeStation 8
 

Attachments

  • Euro.gif
    Euro.gif
    50.4 KB · Views: 242
With the following all closing near the high, expect some pullback before resumption of Friday's action.
EUR/USD
EUR/JPY
GBP/USD
 
see previous post - an alert trader shorted the market close.

EUR/USD - DOWN GAP 68 pips Week should close higher than the open.

EUR/JPY - DOWN GAP 50 pips

GBP/USD - DOWN GAP 47 pips I also expect cable to finish the week higher than the open.

Attached chart is weekly EUR/USD and it has given several buy signals
white dots on week 6 & 7 are Tom DeMark analog signals
pink dot on week 8 is something old time tradestation users call IYD (marks tops/bottoms)
large light blue dot is called a key reversal
the bar is painted with two signals 1. Walter Bressert's RSI buy signal & a Wonder Bar Buy signal.

And I nearly missed the green dot under the new week - this is an eKam power pivot originally coded by Orc - who i believe is Alex Smith here [email protected]
"give credit where credit is due"

All of my posts are intended only as instructional & for entertainment. Many times I am wrong.
 

Attachments

  • Euro.gif
    Euro.gif
    50.3 KB · Views: 202
20/06 trading in EUR/USD needed to make a low of 2150 or lower to avoid a daily buy signal on my system,
which it has done. While the weekly looks good we need the daily to join the fun before we enter a long position.
 
Last edited:
At the end of today's trading (remember TradeStation ends the forex day at 5pm EST - I don't know why they do, but they do) and so I draw my hand charts based on that data. And I have both a buy and a sell chart.
The Sell chart gave a signal to sell EUR/USD, however I'm suspicious because of the weekly data I reported.
However on the bar counts you can see from the prior post with the weekly chart that this is week 9 and it would be a nice setup for 9 to make the low. Looking at early action on USD/JPY for a clue it would seem the sell signal on EUR/USD may be correct.

All of my posts are intended only as instructional & for entertainment. Many times I am wrong.
 
21/06 Morning thoughts: EUR/USD A Buy Failure will lead to renewed selling. I have support at 1.2050 and if that level gets broken, then I want to see a daily close below 1.2028 to make bar 13 ---- I will be working today on time lines.
 

Attachments

  • Eurodaily.gif
    Eurodaily.gif
    37.2 KB · Views: 200
The Sell chart gave a signal to sell EUR/USD, however I'm suspicious because of the weekly data I reported.

Above is taken from Monday night's comment two posts above - pretty much on target!
 
Last edited:
22/06 Trading thoughts:

EUR/USD - close on or near the high - you get a sell off of some degree, before a continuation pattern.

EUR/JPY - UP which is only an educated guess

GBP/USD - same comment as EUR/USD

USD/JPY - an early buy signal, but I don't expect much outa it.


All of my posts are intended only as instructional & for entertainment. Many times I am wrong.
 
Here is a daily EUR/USD chart with timelines.

Not sure how meanful they are.
 

Attachments

  • Euro.gif
    Euro.gif
    33.8 KB · Views: 217
22/06 Trading has followed my post above.
and to repete

I have support at 1.2050 and if that level gets broken, then I want to see a daily close below 1.2028 to make bar 13

While the weekly looks bullish, we do not have a buy on the daily EUR/USD
 
Charts are done...

Not much opinion on anything other than

EUR/USD - waiting on a buy signal

EUR/JPY - looks to be on a sell

GBP/USD - this is sideway'sville. maybe closer to a buy than a sell, but no opinion

USD/JPY - ? sell ?


All of my posts are intended only as instructional & for entertainment. Many times I am wrong.
 
There are two extended bar counts DeMark style and rather than try to explain how they work I will just post a chart - but as you can see it's very likly today will be a bar 13 and I would point out this is but one way of finding a bottom/top. Another being the time line.

Chart is EUR/USD done via TradeStation 8
 

Attachments

  • Euro.gif
    Euro.gif
    33.3 KB · Views: 198
24/06 Trading

EUR/USD - I wanted to report an early buy signal on EUR/USD, BUT IT MISSED BY ABOUT 6 PIPS OF IT. We did make a bar 13 - see the chart
neverthless I'm sure there may be some buying power that take it up tomorrow, but for me the wait continues. 2015 was a double bottom low with 15/06

EUR/JPY - ? continuation of the down move ? (not sure)

GBP/USD - ? close was near the low, so we may go up ?

USD/JPY - I got a buy signal today, but believe 24/06 trading will see a lower close.
 

Attachments

  • Euro.gif
    Euro.gif
    33.9 KB · Views: 185
Last edited:
Back
Top