Da.DesiTrader's FX Journal using Chart Patterns

Da.DesiTrader

Well-known member
Messages
472
Likes
3
Hi All,

In order to discipline and educate myself, I have decided to create and maintain a journal. I have been told by many profitable traders that chart patterns are one of the most profitable ways of trading (if you do it right).

I am trying to approach it in following 5 steps method:

1. Continue to learn about chart patterns and identify them as they are devloping.
2. Analyse the patterns and their likely outcome based on where they are with reference to recent S/R.
3. How the patterns and trends look like on multiple TFs
4. Is there any confluence from other indications (Divergence / Fibs / etc)
5. Analyse whether the risk reward ratio is in order for a profitable trade.

Then I will look to setup a trade with entry, stop loss and trade profit levels. Following that, I will post my results, if I took the trade or else discuss the results if it was missed.

I will very much appreciate in your input into how I can improve my trading strategy (5 steps laid above) and optimise entry/stoploss and trade profit levels.

I will look for all major / minor currency pairs with potential patterns (excluding the exotics which have crazy spreads).

Appreciate your input in advance.

Cheers
 
Last edited:
I've just seen your latest trade on WS's thread. Very nice. I shall be watching this with interest.

Split
 
Hi All, thanks for encouragement. See attached the EUR/AUD 4H chart. It's a descending triangle with 60SMA plotted on chart.

5 Step methodology is below:

1. Identified a pattern in development on EUR/AUD. It's a descending triangle with possible breakout in either direction. (screen attached)

2. Recent S/R's also plotted on chart. Looks like 16300 was previous resistance and later did not hold as support, became resistance again. Overall, that's a bearish character. (screen attached)

3. On daily chart, the price breached 60MA in a downtrend only twice. Both times, it then continued in the direction of the trend. Last time was around July, and this time on 26 Nove. The July breach lasted for 6 days, this time lasted for 5 days, and price has just fallen below daily 60 SMA. That's bearish on higher T/F as well.

4. Price is in the region of 61.8% retracement from previous swing low (arnd 17 Nov) and swing high (arnd 26 Nov). RSI/ADX/MACD/Williams, none of them show divergence to indicate a move on the upside. They are all in sync with price. Bearish bias established.(screen attached)

5. Regarding risk/reward. I would prefer to enter at the break of previous low candle. (ie, break below 16170.5). The stop loss to be above recent high candle (ie, 16334) which is also above recent resistance and also 50% fib restrace around 16300 region. This stop loss is also above the triangle.

So entry is 16168 with stop loss of 16340 (padded both by a few pips). Total risk is 172. The daily ATR is also below 155 for past few days. So good.

Target would be double of 172 at least 15824 (which is below annual lows, so not great), but let's see. Therefore will be looking to b/e soon as trade goes in blue.

Alternatively, go long at break of 16334 (which is also break of 60SMA) , with similar risk/reward ratio and stop loss reasoning - Just reverse it.

In summary:
Long at 16340, s/l: 16168 (risk of 172), T/P: 16512 and more.
Short at 16168, s/l 16340 (risk of 172), T/P: 15996 and more.


Will let you know how it goes. Any comments on improvement are more than welcome.
 

Attachments

  • EURAUD 06 Dec.jpg
    EURAUD 06 Dec.jpg
    128.4 KB · Views: 558
  • EURAUD 06 Dec_confl.JPG
    EURAUD 06 Dec_confl.JPG
    176.3 KB · Views: 482
Hi All, thanks for encouragement. See attached the EUR/AUD 4H chart. It's a descending triangle with 60SMA plotted on chart.

5 Step methodology is below:

1. Identified a pattern in development on EUR/AUD. It's a descending triangle with possible breakout in either direction. (screen attached)

2. Recent S/R's also plotted on chart. Looks like 16300 was previous resistance and later did not hold as support, became resistance again. Overall, that's a bearish character. (screen attached)

3. On daily chart, the price breached 60MA in a downtrend only twice. Both times, it then continued in the direction of the trend. Last time was around July, and this time on 26 Nove. The July breach lasted for 6 days, this time lasted for 5 days, and price has just fallen below daily 60 SMA. That's bearish on higher T/F as well.

4. Price is in the region of 61.8% retracement from previous swing low (arnd 17 Nov) and swing high (arnd 26 Nov). RSI/ADX/MACD/Williams, none of them show divergence to indicate a move on the upside. They are all in sync with price. Bearish bias established.(screen attached)

5. Regarding risk/reward. I would prefer to enter at the break of previous low candle. (ie, break below 16170.5). The stop loss to be above recent high candle (ie, 16334) which is also above recent resistance and also 50% fib restrace around 16300 region. This stop loss is also above the triangle.

So entry is 16168 with stop loss of 16340 (padded both by a few pips). Total risk is 172. The daily ATR is also below 155 for past few days. So good.

Target would be double of 172 at least 15824 (which is below annual lows, so not great), but let's see. Therefore will be looking to b/e soon as trade goes in blue.

Alternatively, go long at break of 16334 (which is also break of 60SMA) , with similar risk/reward ratio and stop loss reasoning - Just reverse it.

In summary:
Long at 16340, s/l: 16168 (risk of 172), T/P: 16512 and more.
Short at 16168, s/l 16340 (risk of 172), T/P: 15996 and more.


Will let you know how it goes. Any comments on improvement are more than welcome.

Short trade trigerred 10 December 00:30 GMT.
 
Stop moved to b/e, as trade has moved more than halfway into target. 100+ pips in profit at the moment.
 
Trade closed at 1.6056. Target not achieved, however, price maintaining itself in retracement channel.


Total balance in pips based on pattern based FX trading: +112.
 
Thanks WS and Pipnator. Am still learning. The price reached profit target and a bit more a few hours after I closed it.

Lessons learned from this trade:

- Perform a thorough analysis, its worthwhile.
- Go for conservative entry (suiting to individual risk appetite).
- Do not aim for a profit target which is beyond support or resistance on higher T/F.
- Exit half position midway through the target and leave the remaining run at b/e towards profit target, even if it comes back, it was a risk free trade.

As in this trade, it would've hit the profit target but I was too greedy to leave anything on the table.
 
Excellent post-trade-analysis.
It's so difficult to put oneself in to this kind of disciplined trading approach. Thanks a lot for making your journal, an open book. Newbies, like me, would find it really helpful, to read and learn.
 
Excellent post-trade-analysis.
It's so difficult to put oneself in to this kind of disciplined trading approach. Thanks a lot for making your journal, an open book. Newbies, like me, would find it really helpful, to read and learn.

I would like to add to that too

very good discipline, money management , risk management and analysis

desitrader is making very very good progress and I am very very impressed

keep it up my friend

once again as tupac shakur would say

all eyes on you !!
 
Ok so here we are with AUD/JPY. We follow the same 5 steps.

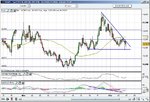
1. This is a falling wedge pattern, and TA suggests it is a bullish pattern specially in continuation of a trend. On daily TF, this pair has been in uptrend this year.

2. 7940, 8000 and 8171 are recent support and resistance levels. Price bounced back from 61.8% of pullback from recent upswing (around 7900 level). That's bullish.

3. Trend is up on daily tf, price always bounced back above 60SMA in the past, however, this time it has breached for longer period than previous breaches. Maybe this is going into consolidation.

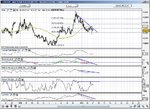
4. Bullish divergence on MACD. Other indicators also either in support or not showing bearish signs. (second chart)

5. This is the tricky bit. I will prefer to buy at the bounce of resistance of this channel, however, as price has moved upwards from that already, then I would normally be looking to go long at high of previous high candle ie, 8098 (but this is very close to round number 8100), so instead i will go above the swing high candle before ie, 8157. Alternatively, if price does not make new high and starts to go down before breaking 8157, then, I will buy just before 61.81% at 7940ish. Lastly, if price breaks below previous low of 7859, then I will short it (as it will also be a break of this pattern).

Long scenario:
Stop loss for first entry at 8157 would be at 8000 (which is also below 38.2% and above the daily ATR).

If first entry doesnt kick in and second one does around 7940, then stop loss would be low of previous candle around 7860.

Short scenario:
Stop loss for short would be above 8000, whole number kicking in and also above 61.8 and 50% retracement.


So here it comes down to (all entries padded by a few pips to keep numbers simple for me and to take few of spreads into account):

Long at 8160, s/l: 7990 (risk of 170), T/P: 8330 and more.
Long at 7940, s/l: 7850 (risk of 90), T/P: 8030 and more.
Short at 7855, s/l 8010 (risk of 155), T/P: 7700 and more.

If one long kicks in, other long order will be cancelled.

Will let you know how it goes. Any comments on improvement are more than welcome. I was struggling with my entry for this one. Will really appreciate any advice.

Cheers
 

Attachments

  • AUDJPY 19DEC.JPG
    AUDJPY 19DEC.JPG
    133.2 KB · Views: 231
  • AUDJPY 19DEC.JPG_confl.JPG
    AUDJPY 19DEC.JPG_confl.JPG
    209.8 KB · Views: 221
Will just add one of my recent trades on FTSE as well.

Short FTSE at 5340, Stop 5410, Target below 5260.
 
Will just add one of my recent trades on FTSE as well.

Short FTSE at 5340, Stop 5410, Target below 5260.

tut tut...it's supposed to be a forex journal, now you're throwing in a dirty indice as well...boo...;) Cracking journal bud, keep posting...:)
 
Haha. Thanks Blackswan for your kind comments. I will really appreciate if you have any suggestions on filtering my entries and stops once patterns are identified. I have read about too many ways of doing this, it seems to me that all in all, its just finding an excuse to get in (ie, some crazy combination of MA crossovers, 10% distance from height of flagpole/channel starting width with a stop 25% away from entry as Ed Ponsi suggests).

Would value your experience in refining this part of my methodology.

Cheers.

P.S. FTSE is my first love, and first love is well.... first love :) I will try to get over it as far as this journal is concerned :)
 
Ok so here we are with AUD/JPY. We follow the same 5 steps.

1. This is a falling wedge pattern, and TA suggests it is a bullish pattern specially in continuation of a trend. On daily TF, this pair has been in uptrend this year.

2. 7940, 8000 and 8171 are recent support and resistance levels. Price bounced back from 61.8% of pullback from recent upswing (around 7900 level). That's bullish.

3. Trend is up on daily tf, price always bounced back above 60SMA in the past, however, this time it has breached for longer period than previous breaches. Maybe this is going into consolidation.

4. Bullish divergence on MACD. Other indicators also either in support or not showing bearish signs. (second chart)

5. This is the tricky bit. I will prefer to buy at the bounce of resistance of this channel, however, as price has moved upwards from that already, then I would normally be looking to go long at high of previous high candle ie, 8098 (but this is very close to round number 8100), so instead i will go above the swing high candle before ie, 8157. Alternatively, if price does not make new high and starts to go down before breaking 8157, then, I will buy just before 61.81% at 7940ish. Lastly, if price breaks below previous low of 7859, then I will short it (as it will also be a break of this pattern).

Long scenario:
Stop loss for first entry at 8157 would be at 8000 (which is also below 38.2% and above the daily ATR).

If first entry doesnt kick in and second one does around 7940, then stop loss would be low of previous candle around 7860.

Short scenario:
Stop loss for short would be above 8000, whole number kicking in and also above 61.8 and 50% retracement.


So here it comes down to (all entries padded by a few pips to keep numbers simple for me and to take few of spreads into account):

Long at 8160, s/l: 7990 (risk of 170), T/P: 8330 and more.
Long at 7940, s/l: 7850 (risk of 90), T/P: 8030 and more.
Short at 7855, s/l 8010 (risk of 155), T/P: 7700 and more.

If one long kicks in, other long order will be cancelled.

Will let you know how it goes. Any comments on improvement are more than welcome. I was struggling with my entry for this one. Will really appreciate any advice.

Cheers

Long at 8160, s/l: 7990 (risk of 170), T/P: 8330 and more............. trigerred last night. Half position closed at 8238 (profit of 78 pips). Stop moved to b/e for the remaining half position.

Cheers
 
Top