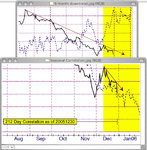
Current Spreads Journal

Capital: a terrible thing to waste.

Did I miss something here?

Were you traders, talking about Cattle/Feeder?

Do you see any chart patterns, do you see any moving average crossover, oscillator divergence, or breakout to show the trend has changed?

What about momentum?

“The USDA is scheduled to release the next … semiannual Cattle Inventory estimate January 27.” You know what happened after the last report. The correlation study surly is a warning against buying the normal pattern, at least until February. Did you read any books or articles about spreads, which suggested this is an entry signal?

Why would anyone be buying it here?
fastnet said:
I've been thinking about the LC-FC spread . . . . . . I wouldn't like to be have 4 unhedged FC contracts at $2000/unit move for any length of time. I am also unsure whether CME

Can anyone advise?
Is there another way to enter this trade than by opening 9 contracts?
 

Attachments

  • Cattle:Feeder.jpg
    Cattle:Feeder.jpg
    334.4 KB · Views: 235
I entered the LC/FC April'06 trade back on December 14. Needless to say I am down today by about $250 on 1 contract of each. I entered the trade on that date based upon what I saw was a 1-2-3 formation. Am I missing something, or did I misinterpret ?? GT, you are correct about the correlation studies - they show this trade "going south" but I still entered this trade nevertheless having been burned a little by the correlation studies on other trades. As FN and I were discussing in another thread, I am not sure how much credence, or to what use, I give MRCI's correlation studies, other than as another useful tool.

Today I bought 2 spreads (4 contracts total) of the June 06/Aug 06 Live Cattle calendar spread. This was based on the seasonality and a 1-2-3 formation. Anyone have any thoughts ?

Jxntrader
 
Jxntntrader>spread and will probably exit tomorrow depending on how the market looks during the day.

Interesting comment. How do you check simultaneous trades during the day? The only reliable spread quote is the close.


GT - I use futuresource.com - it will chart spreads intra-day although it's still 15-20 minutes behind the real-time.
 
crawling channel

Aloha Jxn,
jxntntrader said:
Am I missing something, or did I misinterpret??
jxntn is there any way you can post a chart. What are you on windows or Mac?

I crop a screen capture to post what is on my screen.
they show this trade "going south"
My concern was not what it showed against your trade. What did you have in Favor of the trade is my concern. Trendlines, Stochastic, Parabolic?

What about a realizable chart pattern?
burned a little by the correlation studies on other trades.
The longer-term charts are the way to bet. Especially when Jerry suggests them. But lets look at the big picture. The 15-year studies were current as of a year ago. Not a month, Not 6 weeks, but a year going back another 15 years.

The overlay to current price was carved in stone when the trade was recommended, late last year. The correlation study is current as of today. Jerry would not be giving it to us if he did not think it was significant. It becomes valid when backed up by current events, (like the report that is due later this month), and technical studies. I just don’t see a purchase in the charts. What do you see that would want to make you throw capital down a well?
I am not sure how much credence, or to what use, I give MRCI's correlation studies, other than as another useful tool.
What good is a tool if you do not use it. The race does not always go to the strongest or the swiftest, but that is the way to bet. Similarly give the 15-year mean greeter weight than the few years that the correlation pattern is picking up. But in the end. Which pattern are prices actually following. Not what should the follow, not what you want them to follow. I am not following cows/feeder this year. In my experience calendar spreads offer more return on margin with less drawdown. The unexpected can nail you quick with a to multi pit spread.

Today I bought 2 spreads (4 contracts total) of the June 06/Aug 06 Live Cattle calendar spread. This was based on the seasonality and a 1-2-3 formation. Anyone have any thoughts?

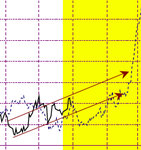
Prices seem to be crawling up a channel. As you can see by the chart it looks pretty good . What are your plans if it follows the seasonal projection very closely?
 

Attachments

  • Cattle.jpg
    Cattle.jpg
    87 KB · Views: 225
Hi Guys

LC M6 - LC Q6: Jxn- I like the look of this too, I'm waiting for a breakout and close above the channel but your 1-2-3 low and close above resistance around 1.0 to 1.15 look good to me.

LC J6 - FC J6: with you on this one GT, I would like to see the downtrend line broken here before entering. I tend to leave the 1-2-3 lows alone in such an established downtrend and enter on the next technical breakout (RH, congestion area, trendline etc...) once the move up is seen to continue.
I see your entry signal here Jxn if you based it on the 1-2-3 low which formed around 7th - 10th Dec, at the time of your entry the spread looked to be following the 5 & 15 year patterns so I gues you didn't do much wrong here if these entries are part of your trading plan.

Anyone had a look at Steve & Jerry's new book yet "The Encyclopedia of Commodity and Financial Spreads"?
 

Attachments

  • lcj6-fcj6.png
    lcj6-fcj6.png
    83.1 KB · Views: 274
  • lcm6-lcq6.png
    lcm6-lcq6.png
    63.4 KB · Views: 247
Hello again GT and others, in response:

I crop a screen capture to post what is on my screen.My concern was not what it showed against your trade. What did you have in Favor of the trade is my concern. Trendlines, Stochastic, Parabolic?

Right now the trading plan that I am trying to stick with is to go "by the book" with Joe Ross' Spreads/Seasonals book. Based on that I entered the decision to go ahead with the LC/FC trade (see Kato's post showing the 1-2-3). Upon further reflection I can see the drawbacks to entering this trade at this time. If I had to do all over again, though, I probably would've still entered it anyways, although the correlation studies concerned me somewhat. Further I just didn't see anything by reading the news that would concern me. Finally, as I've posted earlier in my posts to Fastnet, I'm an extreme "newbie" so I'm not sure what continuing to study this trade any further (trendlines, stochastics, parabolic, etc..) would've done other than to possibly confuse me and give me further second-guessing headaches. Besides, even from what I read from the "experts", no trade can be guaranteed.

I am not following cows/feeder this year. In my experience calendar spreads offer more return on margin with less drawdown. The unexpected can nail you quick with a to multi pit spread.

I will certainly agree that non-calendar spreads appear to be much more volatile. Before I actually "put any money down" I demo-traded for about 3 months. One thing I decided that I would not do was to get involved in foreign currency spreads. The volatility was stomach-churning. Besides, even after reading several of Jerry's commentaries, I just don't see much correlation between currencies. Anyways, that's off the subject. Time will tell on the LC/FC trade. I have a $800 to $900 mental stop on this trade so we will see what happens.


Prices seem to be crawling up a channel. As you can see by the chart it looks pretty good . What are your plans if it follows the seasonal projection very closely?

My exit plans again have been "by the book". Well, sorta. I have been exiting my trades no later than the optimized dates. Some of the trades I have gotten out a few days earlier if the profit level has reached the "average profit on winning trades" using mrci data, and if I see that RSI levels are above or near the 70 level. In other words, my plans are not completely set in stone - I may start my subscription back up to barchart.com and start using the parabolic as you've suggested...but for now I'm too cheap for that.

Kato - I just got notice from Amazon that they have shipped me the new Encyclopedia...Spreads book. I will let you know what I think of it.

Thanks for the continuing postings on this board and please keep up any suggestions or recommendations.

Jxntntrader
 
Hi All - on Sunday night I was going to ask exactly the same question as jxntn regarding correlation. I suppose the way I decided to think about them was as an extra incentive when placing a trade but ONLY when the correlation is is the direction of the expected 5/15 year expected trend ie confirms your planned trade. They should also be used (as GT has done) as part of a trade filtering exercise.

My other main question was regarding the highlighted window in MRCI's charts. I understand that these are the highly correlated, high probability periods but what about trading obvious seasonal tendencies in charts that aren't highlighted? These trades would be taken from the many included in the ''special spread chart section'' (usually accompanied by a correlation for current year).

For example - MRCI advises that I get out of my April - Feb lean hog trade by close of play tomorrow. The next hog trade to roll into and highlighted by MRCI is the buy June sell October. However what if I fancy a slower burn trade?? If I scroll through the other charts given by MRCI (special spread chart section) I can see an attractive looking June - Dec LH chart and an equally appealing April - August LH. Neither were picked out by Jerry for Jan spread trades but seem no less relevant.

Could anyone comment on the disadvantage of picking one of the charts that hasn't been selected by MRCI and so doesn't have the highlighted yellow period?

BTW - it's great to have you back GT!!

Cheers,

FN

PS - I never did take the LC-FC trade preferring to watch and wait from the sidelines (coward!) ;-)
 
Hello again FN,

For example - MRCI advises that I get out of my April - Feb lean hog trade by close of play tomorrow. The next hog trade to roll into and highlighted by MRCI is the buy June sell October. However what if I fancy a slower burn trade??

Remember though that MRCI recommends Jan. 10 for the same trade (see Strategy #2555).

If I scroll through the other charts given by MRCI (special spread chart section) I can see an attractive looking June - Dec LH chart and an equally appealing April - August LH. Neither were picked out by Jerry for Jan spread trades but seem no less relevant.

Could anyone comment on the disadvantage of picking one of the charts that hasn't been selected by MRCI and so doesn't have the highlighted yellow period?

You might want to check the "Special Spread Charts" section and have them email to you the lean hogs spread charts. From there you can analyze the 15 year and 5 year data. Also - remember that MRCI has other strategies that they print up in their Historical Reports. The Jun/Dec LH just so happens to be one of those strategies ( I happened to buy that particular report). I suspect that giving you any further information of that trade on here might be some type of copyright violation so I won't go into the specifics.

Nice to have other participants, don't you think ?

Jxntntrader
 
It's great to have other opinions/thoughts - absolutely.

So - I like the look of lean hogs buy June sell Dec (potential $10 increase [$4000] by early March). But I also like the look of April - August - (looks like there's a bottom in at the start of a potential $4 increase culminating at the end Jan. This latter trade also looks very attractive in the short term.

I admit that I know NOTHING about the funnymentals of either trade and the relative expiry dates - I am simply going in using the 15 year charts and TA.

Just hypothetically speaking and to generate discussion why would June- Dec be preferred to April - June? (if it is).

Cheers,

FN

BTW - are those special historical charts worth the investment? What do they look like (in terms of additional content?) They're pretty steep on top of the MRCI subscription eh?
 
OK here goes, just my own opinions, hope it comes across as constructive commentary and not critical of your trade ideas ( I worked on long april/short august, hope this was the trade you were looking at, you mention April/June later in your post):

LH M6 - LH Z6 shows a strong historical move up from the Jan bottom to early March top, I like the convergence of 5 & 15 year patterns later in the month suggesting that the longer term historical move has remained valid in recent years. What would concern me here is that the spread has only traded above the 20 level once in the last 30 years and has met resistance at 20 in 01,04 & 05 this doesn't leave much room for the trade to develop without a significant breakthrough the 20 level.

LH J6 - LH Q6 I can't really see much in favour of this trade, the 5 & 15 year patterns diverge through Jan suggesting that the historical 15 year seasonal move may be losing its validity, in recent years the spread has shown a tendency to level off and begin moving down through Januuary. The spread has historically topped out by the end of Jan and I would prefer to trade the inverse of this spread (long Aug/short Apr) looking for an entry signal mid to late Feb.

I download all the "Special Spread" .pdf's and trawl through them 2 or 3 times a week looking for spreads to track, I would estimate that 60% of the spreads I follow are my own selections the others are from Jerry's weekly report and the monthly strategies. The pdf's definitely worth looking through in my opinion, not sure about the historical reports, I've not used them but you can download samples from the MRCI website.

Cheers
Kato
 
Schap

21572.jpg


In Schap's book on spread trading he says
Schap> “it is a good idea to focus on the spread as a whole, not on the individual legs of the spread.”
He goes on to explain it in complex mathematical terms.
fastnet said:
I see the problem as a lack of visibility regarding what is actually going on.
 
Hi Kato - thanks for your post - it's reassuring to hear that some self-trawling for trades also bear fruit - being as picky as I am (seasonals only) there are few trades left.

You raised a very important point in your email - that of actual spread levels reached in the past (never more than 20 in June-Dec Hog trade). The MRCI chart seems to indicate that spreads of 24-26 could easily be achieved. I find this VERY confusing. The main chart shows the 15 year pattern against the current year. Why does the 15 year line trace above 20 if this value has never been reached in the past 15 years??? Below is the 15/5 years traces. These show relative highs lows and I find easier to understand.

To be honest Kato before you pointed this out I had forgotten about this quirk of the charts. I have, however, asked about this before. I remember GT sending a reply which I will look out later (at work now).

You say that the spread has been capped at 20 in the past. I initially thought that this still meant there were potentially $3 ($1200/contract) up for grabs. However a closer look shows that before 2000 the spread was usually capped at 15. Spread is already at 17. . . . . . can anyone help with this confusion. I understand that the main MRCI chart (15 year vs current and 15/5) must change every year to incorporate the latest years data. But why would it seem to show the spread potentially widening to +26 when clearly this is very unlikely based on past years data? Is is because the y-axis units are always changed to show a LIKELY price range for that year??

Yours confused -

FN
 
Hi FN

I went through exactly the same confusion as yourself until someone showed me that the 15 year pattern you see plotted against the current price should be thought of as an image superimposed against the current price line to gauge how well the historical pattern is correlating, the image is not scaled to the prices on the y-axis and should not be used on its own to project targets, you will find the image is stretched or condensed vertically as the spread develops to best-fit the price line. This tip came a bit late for me and cost me a few trades where I bought straight into resistance, I now religiously check the longer term charts to make sure potential trades have room to develop.
Hope this saves you a few $$$ :D

Kato.
 
Really. . . . pretty fundamental stuff eh - and v confusing until you get used to it. Thanks for the clarification.

With this in mind, and if you get a minute, I'd be interested in hearing what you think about the long July short Sept 06 Wheat trade (MGE) in MRCI's special charts. This is another trade I've been looking at.

Thanks again Kato -

FN
 
Top