Comprehensive Trading System/Methodology

Hi,

Thanks for the clarifications. This morning I have been looking at Cable and noticed an extreme reversal set-up in the M1 timeframe as price broke the previous support in M30.
Naturally, I didn't do anything in anticipation of a further shank.

I then noticed an extreme reversal set-up in M5 as the 10bol moved up inside the 20,40 and 60bol in the trigger timeframe and OSMA moved above the axis, MACD same peak retrace. The way I understand this is that the trigger time frame was now displaying a type B reversal supported by an extreme set up in the M5. Price broke above the previous M30 support. Consequently I moved in and traded for a quick 20pip profit.

I hope that I'm trading your system correctly. Do you ever trade where there is only a setup in one timeframe? I find that there is often a set-up in the trigger M1 timeframe at M30 SBR RBS levels, without there being one in the intervening M5 timeframe.

Many thanks,


Stefam

Your points are highlighted in bold italic with answers to follow;

This morning I have been looking at Cable and noticed an extreme reversal set-up in the M1 timeframe as price broke the previous support in M30.
Naturally, I didn't do anything in anticipation of a further shank. I then noticed an extreme reversal set-up in M5 as the 10bol moved up inside the 20,40 and 60bol in the trigger timeframe and OSMA moved above the axis, MACD same peak retrace. The way I understand this is that the trigger time frame was now displaying a type B reversal supported by an extreme set up in the M5. Price broke above the previous M30 support. Consequently I moved in and traded for a quick 20pip profit


Not sure what a shank is? lol, but I know what you mean. Yeh 0709am gmt saw a 1min Rev Extr with a developing 5min Rev Extr, then 0714am gmt saw the 1min Rev B with 5min Rev Extr...potential support was the previous 1hr swing lo's = prev supp=potential supp and the 4hr ascending supp t/line-1st test. Well done great set-up.

Do you ever trade where there is only a setup in one timeframe? I find that there is often a set-up in the trigger M1 timeframe at M30 SBR RBS levels, without there being one in the intervening M5 timeframe.

Yes I do trade when there is only a 1min trigger t/f set-up in these circumstances

a. In a 5min range-per overall price action-peak/valley analysis
b. When supported by small chart conditions to the 5min + chart if there isn't a 5min (+) main chart supporting set-up-which is always preferred.

I find that there is often a set-up in the trigger M1 timeframe at M30 SBR RBS levels, without there being one in the intervening M5 timeframe

This can happen of course but the general rule of thumb is that the Re-entry set-up should appear on the t/f below that the trend first exists on and that the potential sbr/rbs has been identified on....so that a 1min re-entry set-up should be into the 5min trend and at it's potential sbr/rbs, whereas a 5min re-entry set-up (times as a 1min Reversal set-up) should be into the 30min trend and at it's potential sbr/rbs.

BTW: I use the 1hr t/f in respect of previous swing hi/lo zones (the basis of the pot supp/res/sbr/rbs) as a proxy for the 30min (which I still use for identifying trend per overall price action-peak/valley analysis) the 1hr is more widely used and likely to see more participants/volume at the potential supp/res/sbr/rbs zones...just a personal choice.

G/L
 
Last edited:
BBMAC, did you manage to jump on the downtrend??

I managed to catch it on 2 occasions so far. However, I'm not sure its been done entirely in accordance to your system. Its been quite difficult isolating the swing highs & lows in the M5 timeframe. I think I managed type 1 re-entry on both occasions with the 10/20 bol flip on the trigger time period. At the moment, we are approaching some kind of swing high, however, I am unwilling to enter this time given that OSMA is teetering below the axis.

Hope that the re-entry set-ups will become clearer to me in due course.


Cheers,


Stef
 
BBMAC, did you manage to jump on the downtrend??

I managed to catch it on 2 occasions so far. However, I'm not sure its been done entirely in accordance to your system. Its been quite difficult isolating the swing highs & lows in the M5 timeframe. I think I managed type 1 re-entry on both occasions with the 10/20 bol flip on the trigger time period. At the moment, we are approaching some kind of swing high, however, I am unwilling to enter this time given that OSMA is teetering below the axis.

Hope that the re-entry set-ups will become clearer to me in due course.

Hi,

Yes it was pretty relentless selling with price generally in shallow pullbacks to the 1min 10bol before it started again. Downtrend exteneded to the 1hr then 4hr t/f's. I caught the 1min Re-entry set-ups: 0853am Re-entry 1 and the 1215pm Re-entry 3 but saw no other Re-entry set-ups either 1min or 5min @ pre-ident pot sbr. There were howevere useful thrust candles on all time frames and I traded one on the 15min when it's own macd hist was crossed down with the next 2 t/f's pointing down (and actually crossed down below axis..1hr and 4hr) Sometimes when price does not retrace sufficiently to form a potential sbr/rbs zone on a break and fibs are not helping such is the shallowness of the pullbacks, the thrust candles can be of use, in the circumstances detailed above.
 
Confluence

The Fibs shown on the 1Hr Gbpusd screenshot are drawn from the following major swing highs;

4181-3742, (Mon Hi-Lo)
4304-3742, (Fri Hi - Mon Lo)
4661-3742,
4984-3742

Interesting area at A in screenshot being the previous swing lows=previous support=potential sbr with confluence of 3 x fibs...Could be interesting if price reached it. Meanwhile price/recovery has been restrained at the 38.2% of the 4181-3742move (mon hi-lo)

aey2hh.jpg
 
Dear BBMAC,

I'm finding that I'm getting caught out quite a bit using theswing highs/lows off the M5 chart. Some reversal set-ups on the trigger M1 actually experience follow through leaving me with losses.

I feel I need to ration my trades far more thoroughly in future. Should I for instance rely more on H1 levels for my SBR/RBS? Similarly, confirming set-ups in M5 may also be the order of the day.
The fib levels you rely upon are the high/low of the 2 previous trading sessions?


Many thanks,


Stefan
 
I'm finding that I'm getting caught out quite a bit using theswing highs/lows off the M5 chart. Some reversal set-ups on the trigger M1 actually experience follow through leaving me with losses.

I feel I need to ration my trades far more thoroughly in future. Should I for instance rely more on H1 levels for my SBR/RBS? Similarly, confirming set-ups in M5 may also be the order of the day. The fib levels you rely upon are the high/low of the 2 previous trading sessions?
Stefan

Hi,

1. Yes you really have to be careful using the swing hi/lo's off the intermediate 5min chart. Remember that i. the confluence of supp/res factors is always favoured and that ii. On the 5min unless that t/f was in a range I would not be looking to reverse against a trend unless the 1min trigger had supporting 5min and/or small charts supporting conditions. I generally use the 5min previous swing hi/lo's as potential sbr/rbs for a 1min Re-entry to trend set-up into a 5min (+) trend.

2. Yes quality rather than quantity is the key. Don't be tempted to enter at every little bit of divergence or at every 1min set-up, make sure you have confluence. obviously a 1min trigger set-up with a 5min intermediate supporting set-up @ 1hr potential supp/res/sbr/rbs with confluence of other supp/res factors would be a stronger trade and generally higher in probability of a successful outcome.

3. The fib levels on the 5min main chart template are the retrace and ext levels for y/days hi-lo/lo-hi range yes. I have fibs drawn from all the relevant major swings on a seperate chart and a note of those levels.

G/L
 
Last edited:
Stefan:

The 1min t/f is a trigger, that is it's only purpose. whilst all componet parts of this trading system/methodology are important,... don't get hung up on 1min set-ups, you have to filter them. your focus should be in

a. identifying overall price action conditions on intermediate and trend t/f (5m & 30min) per classic peak/valley analysis...ie ranging or trending
b. pre-identifying potential supp/res/sbr/rbs zones (at outlined in part I doc in your posession)

Don't focus on the set-ups and then look for b, and to ascertain a after an entry is made at an indicator set-up. Know in advance the areas at which you are looking to trade and know on entry what the overall price action conditions are so that you have the best chance of making an informed decision about whether the optimum conditions exists that give the indicator set-up (s) the highest probability of a successful outcome.

Also, like this morning in gbpusd, don't fall into what I call the 'Reversal trap' yes markets do pullback in a trend such is their nature, but when the macd hists are all pointing/crossed down like this a.m in gbpusd to 1hr, 'with trend' is the order of the day unless you see potential support/resistance confluence and the further confluence of a supporting set-up on 5min +

G/L
 
If you know in advance, the areas at which you are looking to trade, then you are not tempted by any 'false positive' indicator set-up that may develop away from those areas.
 
Re the point made in post above and for example; The 1hr chart (used as proxy for the 30min trend t/f) shows the most immediate zones on that t/f at which I would be looking for a set-up (s) given price's current level. (the screenshot is in spanish but you'll get the idea)

I then look for any confluence with other potential supp/res factors in those zones.
Re the 5min intermediate t/f I am looking for potential sbr/rbs zones for a 1min Re-entry set-up.
 

Attachments

  • t2w.gif
    t2w.gif
    15.8 KB · Views: 275
re post above

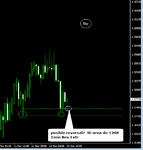
Re that potential support zone ie the 'posible reversal area' in chart attached to post above) look at what happened...a 1min Rev Extr set-up developed there with confluence of the 1 and 5min small charts supporting o/s conditions for a high probability trading opportunity that has seen +50pips available...see screenshots below (again in spanish but you get the idea)

The confluence of the indicator set-up (s) at pre-identified potential support/resistance/sbr/rbs...that's high-probability outcome trading !!
 

Attachments

  • @ 1hr pot support zone.gif
    @ 1hr pot support zone.gif
    11.5 KB · Views: 267
  • 1208 su tiempo.gif
    1208 su tiempo.gif
    13.5 KB · Views: 254
Hi

Just a quick note on a trade I did this morning.
At 7:25 I re-entered a trend and bought at 1.4057
I noticed a retrace in the higher time frames to previous swing highs. With an up trend developing, I figured that this would be a good re-entry opportunity. So with re-entry type 1 & 2 bol flip in the trigger time frame, I executed on the first bullish candle.

What I often find with these set-ups, is that price continues to consolidate, and the set-up no longer appears evident. Nevertheless, I held onto my trade and got out at a small profit 1.40781

I'm reading a book at the moment (a short course in technical trading by Kaufman). In it, he talks about trend trading. Since most of his trades are actually losers, he sits on the winning ones for quite a while. Just wanted to know, do you ever adopt such a strategy, or do you take small profits where ever you can?

Just wanted to know your views on this.


Stef
 
Hi

Just a quick note on a trade I did this morning.
At 7:25 I re-entered a trend and bought at 1.4057
I noticed a retrace in the higher time frames to previous swing highs. With an up trend developing, I figured that this would be a good re-entry opportunity. So with re-entry type 1 & 2 bol flip in the trigger time frame, I executed on the first bullish candle.

What I often find with these set-ups, is that price continues to consolidate, and the set-up no longer appears evident. Nevertheless, I held onto my trade and got out at a small profit 1.40781

I'm reading a book at the moment (a short course in technical trading by Kaufman). In it, he talks about trend trading. Since most of his trades are actually losers, he sits on the winning ones for quite a while. Just wanted to know, do you ever adopt such a strategy, or do you take small profits where ever you can?

Just wanted to know your views on this. Stef

Hi Stefan

I saw that set-up, I have it logged as followed (which you will understand:)

0723am Re-entry 2 (into 5min up trend @ HL/HL. 5min macd crossed up, 30min [and 1hr] crossed up & pointing up) @ pot RBS= prev 5min & 1hr swing Hi zone.

I thought it was a pretty perfect set-up actually;

Price had gapped down at open and quickly found a bottom, closing the gap. At the time of this set-up the 30min (and 1hr macd histograms were crossed up and pointing up) indicating an uptrend direction was probable.

In respect of holding for extended gains, it is advisable to try and hold when all factors are in your favour, particularly when the entries are 'with trend.' In terms of potential resistence , after breaking Friday's High the next potential resistance was the 2 x fib cluster [38.2% 4985-3655, 50% 4661-3655] at the previous 1hr swing Hi zone from 09/03/09.

G/L
 

Attachments

  • 0723am gmt 1min Re-entry 1.gif
    0723am gmt 1min Re-entry 1.gif
    27.5 KB · Views: 253
Last edited:
Don't know if it is just me, but so far this morning, I haven't been able to spot any ideal set ups

I haven't traded today, (taking a few days off) so it's difficult tio comment in retrospect in that I don't know what I would have done in realtime. A quick look back reveals some set-ups @ potential supp/res/sbr/rbs.

Remember your focus should not be on the indicator set-ups, but on identifying

a. overall price action conditions on intermediate and trend t/f's
b. pre-identifying potential supp/res/sbr/rbs on the trend t/f and potential sbr/rbs areas on the intermediate t/f.

Once these are identified you will know only to enter the market if an indicator set-up (s) develops at those areas identified under b, above and only if the optimum overall price action conditions exist, per a. above.


G/L
 
Last edited:
bbmac,

Using your method, approximately how many trades do you get into on average on any particular day?

Hi,

During any 5hr trading session in the most liquid parts of the day, the average is 4-6. What I mean by this is that there will be 4-6 set-ups on average @ pre-identified potential supp/res/sbr/rbs that you can enter the market at knowing that the greatest amount of confluence exists.

Today for example 0715-1215pm gmt there were indicator set-ups @ 0723, 0757, 0938, 1028, 1055, 1103, 1115, 1141 and 1216 but only the 0757, 0938 1055, and 1216 were at areas you could consider to be obvious potential supp/res/sbr/rbs per this system/methodology. (I will leave it to you to see what those 1min set-ups were and what the 5min + supporting set-ups where they existed as applicable.)

So as a general rule of thumb aim for 4-6 in any liquid 5hr session.

Hope this helps.

G/L
 
Hi

I think that I have a tendancy of getting into trades prematurely at times.
This morning at 8:15, I believe that I saw the beginnings of a reversal type B on the trigger chart. The only problem with this was that the aqua 10 bol didn't quite flip within the 40 Bol.
In spite of this, I still bought at 1.4405 only to sell at 1.4436 for a 31 pip profit.

Just wandered if anyone else jumped on this trade?
 
I think that I have a tendancy of getting into trades prematurely at times. This morning at 8:15, I believe that I saw the beginnings of a reversal type B on the trigger chart. The only problem with this was that the aqua 10 bol didn't quite flip within the 40 Bol. In spite of this, I still bought at 1.4405 only to sell at 1.4436 for a 31 pip profit. Just wandered if anyone else jumped on this trade?

Yes it is best to let the trigger set-up develop fully with the reversal candle close as the trigger for entry. in the example you detail above, I had it as an 0812am gmt Rev Extr ii with entry on close of the 0812am 1min Doji candle (appreciate some brokers may be different) The 1min set-up had an imperfect 5min supporting Rev A (imperfect re macd div) and supporting Reversal set-ups 15min and 30min too at the potential support being the previous 1hr swing lo=previous support=potential support with the 2 x fibs confluence.

Screenshot of 1min trigger is below.

Well done
 

Attachments

  • 1min Rev Extr ii.gif
    1min Rev Extr ii.gif
    14.4 KB · Views: 227
Forgot about extreme ii setup!!

However, I still can't see the same peak regular divergence in the OSMA ..... am I missing something?
 
Forgot about extreme ii setup!!

However, I still can't see the same peak regular divergence in the OSMA ..... am I missing something?


Yes, look again more closely....I've reposted the above screenshot of the set-up with a red vertical line drawn through the oscillators at time of the doji entry candle on close, this might be easier for you to see how the characteristics of the oscillators match the charatcteristics of a perfect Reversal Extreme ii set-up

a. Osma regular immediate (same peak/valley) divergence
b. Macd makes a new estreme
c. CCi effectice reg immed div (back inside bol) turns red or blue again.
 

Attachments

  • 1min Rev Extr ii.gif
    1min Rev Extr ii.gif
    14.1 KB · Views: 211
Top