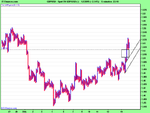
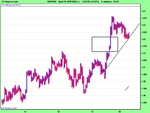
Comprehensive Trading System/Methodology

Reminder re potential Support/resistance/SBR/RBS

Remember that it is the most obvious previous price swing hi/lo areas that form the basis of potential supp/res/sbr/rbs zones as shown in the Identifying Potential Supp/Res....doc (Post 1, page 1) and Part I doc (Post 74, page 10) of this thread.

In identifying these zones on the trend and intermediate time frames, (per the simple methodology outlined,) look too for any of the other main potential supp/res/sbr/rbs factors that fall within those zones for added confluence, ie

a. Fibs, Touted (3rd Party) bids/Offers, and trend lines on 1hr+ are the other 3 main factors
b. pivots, whether they be daily, weekly or monthly as well as Mid pivots are minor factors.

Important

* A previous price swing Hi zone = previous resistance, so that when price approaches it from the underside it has the potential for resistance. When price approaches it in a pullback from the topside it has the potential for rbs.

* A previous price swing Lo zone = previous support, so that when price approaches it from the topside it has the potential for support. When price approaches it in a pullback from the underside it has the potential for sbr.

* A confluence of potential supp/res/sbr/rbs factors is always preferable.

* potential sbr/rbs zones are really only valid when a time frame is trending, better when at least the next 2 time frames above any re-entry set-up at such potential sbr/rbs zone are trending. (A Re-entry [to trend] set-up being identified on the time frame below that that the sbr/rbs zone is identified upon.)
 
By the way, you had a custom indicator in your PDF that shows avg range - Are you able to share that? :)


The indicators are shown here, and are attached.

2vb4hhi.gif


Edit: the screenshot is from a broker feed that uses 5decimal points so of course the average ranges shown are effectively xxx.x
 

Attachments

  • range calc indiicators.zip
    7.4 KB · Views: 132
Hi BB would we be able to add 1 addtional thing to your indicator? Current day, week, month range? :)
 
ALso would like to check on y our Take Profit Target. Would the stop affect it? As in if you set the stop at 23 pips stop loss, do you put a Take Profit at only 23 and above?
 
Hi BB would we be able to add 1 addtional thing to your indicator? Current day, week, month range? :)

Yeh that could be done by adding to the code via metaeditor....go ahead if you can or post on ff.com or similar or even here to see if anyone can do it....would be good to have.
 
ALso would like to check on y our Take Profit Target. Would the stop affect it? As in if you set the stop at 23 pips stop loss, do you put a Take Profit at only 23 and above?

As a rule of thumb - trading conventional wisdom has it that we should aim to keep our average winner larger than the average loser, over any given sample of trades. Indeed some even go so far as to suggest not including the biggest winner across the sample taken, in that equation and then see-ing if the average winner is still bigger than the average loser. Whichever way you look at it you can see the logic ansd it is sound advice.

The risk:reward equation becomes more crucial the lower the strike rate of your trading, (ie the lower the winning trades as a % of total trades.) We all know that even a 25% strike rate can still result in a net profit over any given sample provided the right r:r ratios are adhered to.

I hesitate to post the following because it might attract the 'it can't be done (particularly on a 1min chart,) you must be fibbing' brigade out of the woodwork, but my chosen style borne out of my particular personal tolerances has always been to find a very high strike rate entry point, thus aleviating the presure on r:r ratios, and this I have done resulting in a personal strike rate of over 90%. This coupled with the ability to use smallish stops as a result of fine tuning the trigger entry on a 1min chart means that I don't always achieve a minimum r:r of 1:1. I will qualify this further;

a. I tend to hold trades for bigger gains if the price action momentum is quickly with me.
b. I tend to try and hold trades for more pip gain if with trend Re-entry set-ups are acted at.
c. I tend to hold trades for more gains if I have already reached my aggregated daily/weekly pip target...ie if my stop is paid for from gains made in that trading session.

Where I tend to fall short of the minimum 1:1 r:r gain are;

d. 1min trigger Reversal set-ups against trend that do not have intermediate time frame (+) supporting set-ups.
e. Trades that do not have any real momentum with them.
f. Reversal set-ups(against trend) that dither around, ie no absolute reaction to the potential supp/res that I have acted at.
g. Reversal set-ups in trends that have shown historically shallow pullbacks in that trend
(h. Reversal set-ups that fall within the average daily range)

These are very much generalistaions but a fair reflection of the style/preferences I personally have developed. Yours/others may be and even should be different, and may evlove over time.

The rules of thumb contained in the first paragraph of this post are sound advice.

G/L
 
Last edited:
Tight range in cable in early London/European session staying in the Asian session range circa 5065-5005, then a quick downside break of that asian session range, resulting in support at the previous 1hr swing hi (=previous resistance = potential rbs)shown on 1hr chart below.

1min Reversal extreme set-up there with mni confirming bids in the region 4950/40...a sharp 30+ pip retrace followed.

zy5w74.gif

Still a rangy 1hr chart atm
2qicm5j.gif
 
Nice example of a re-entry to trend set-up today, on screenshot below.
Set-up came at a L on the trigger (on which it set-up) and @ a HL on the intermediate and trend t/f's, and indicated a re-entry into the intermediate and trend t/f uptrends....it is a few pips off the HH seen before the retrace/pullback as I write this, some +50pips up from the entry point. Will it see a with trend follow thru to a new HH? I don't know, but the current strong intraday upmove @ circa 380pips Lo-Hi is well extended from it's 5,10 and 20day averages so I wouldn't be surprised to see it falter,..that said it has some bad u.s data behind it, released earlier.

1zcnvq1.gif


EDIT: 1530pm gmt Just saw a with trend follow thru to new highs...
 
Last edited:
bbmac
is the srb/rbs zone for tomoorrow.a retrace below 1.5220.?
the black rectangle denotes the srb/rbs zone
 

Attachments

  • Spot FX GBP_USD (-).png
    Spot FX GBP_USD (-).png
    15.6 KB · Views: 168
BB

Would like to check on 2 things,

1) If there is a 5 min reversal signal but the 1 min does not conform and it does not show any signal, would you take the trade?

2) On your picture for the SBR or RBS

If the RBS is violated more than 1 time, is it still considered as a valid RBS?

29d9qtg.gif
 
BB

Would like to check on 2 things,

1) If there is a 5 min reversal signal but the 1 min does not conform and it does not show any signal, would you take the trade?

2) On your picture for the SBR or RBS

If the RBS is violated more than 1 time, is it still considered as a valid RBS?

29d9qtg.gif

This would count a lot while trading if that does not happen.
 
we are in the sb/rbs zone now.it is 1.5100 to 1.5220 range.the trend is up.so watching for a reversal back into the uptrend
 
bbmac
is the srb/rbs zone for tomoorrow.a retrace below 1.5220.?
the black rectangle denotes the srb/rbs zone

The most immediate potential rbs zones on the 1hr chart (proxy for the 30min trend t/f) as I see it are shown below. There are of course fibs of the moves up too, not marked on the chart;

311mdz8.gif
 
BB

Would like to check on 2 things,

1) If there is a 5 min reversal signal but the 1 min does not conform and it does not show any signal, would you take the trade?

2) On your picture for the SBR or RBS

If the RBS is violated more than 1 time, is it still considered as a valid RBS?

Answers:

1. A 5min Reversal set-up without a 1min trigger set-up with which to pinpoint the optimum entry is problematic, it can also be frustrating. in these cases I tend to await a 1min set-up but if there is good 1 and 5min small chart confirmation or the first 5min reversal candle is good in the 5min set-up, you can take a chance on this.

2. Sometimes the most immediate potential rbs/sbr zone can be violted in a deeper pullback and price can find supp/res lower/higher up the chart. In this case - that previous swing hi=previous resistance=potential rbs was a 'clean' very obvious area, more obvious in fact than the more immediate areas, in the sense that it resulted in the geater swing. Look first to the most immediate areas but also bear in mind areas that stand out too on your chart, but obviously I wouldn't go back 3 weeks looking for these, but as long as I can see them on my chart I count them as potential for rbs/sbr.

In any event the previous swing hi I had used as potential rbs was not violated as potential rbs only as potential resistance as it was then approached from the underside, violted in the areas you circle...it is only potential rbs when approached in a pukllback from the topside...and to this extent it had not been tested.
 
Last edited:
BB

Would like to check on 2 things,

1) If there is a 5 min reversal signal but the 1 min does not conform and it does not show any signal, would you take the trade?

Good example of this today, see screenshot below of the 5min Rev B set-up at potential supp =38.2% fib of the 4916-5376, (y/days lo-hi) ...the 5min entry would have been close of the hammer candle...ie there was no recognisable 1min trigger t/f set-up although there was regular immed bullish divergence in the 1min oscillators.

250hx4x.gif

fmqp6r.gif
 
Good example of this today, see screenshot below of the 5min Rev B set-up at potential supp =38.2% fib of the 4916-5376, (y/days lo-hi) ...the 5min entry would have been close of the hammer candle...ie there was no recognisable 1min trigger t/f set-up although there was regular immed bullish divergence in the 1min oscillators.

Adding confluence to the above entry is the 1hr re-entry to uptrend set-up shown below at that 38.25 fib and the previous 4hr swing hi [=previous resistance=potential rbs] shown in chart below.

This 1hr re-entry to trend set-up comes at a l on that chart although at a HL on 4hr, so it has a slightly lesser statistical probability of reaching new highs (from the set-up) than had it fell at a HL on both the 1hr and 4hr.

Of course you might not notice the 1hr chart when entereing a tarde at a set-up on the 1min trigger or even 5min as the trigger but you would look further afield once in the trade to see if any confluence exists on other time frames.

G/L
2cnhvgl.gif

blelw.gif
 
Last edited:
yes, a pullback into the srb/rbs zone.you can see the turn at 1.5200 area
there is a downside vertical count of 1.5060 taken from the second move from the top
 

Attachments

  • cable update.png
    cable update.png
    14.1 KB · Views: 160
i am not trying to confuse anybody reading this great thread.i use both candles with oscillators with youre methodology.i also look at the price action with p & f also.each gives you information.the more you have the better.after all ,we are having to make decisions to trade with incomplete information
i have put on the charts as they align up well to the 1 hour cable chart.however,with p/f you can see the price action much more clearly than candlesticks.the chart .i have included the vertical count at 5060 as this is bearish.meaning the second move from 5360 was a biggish move.so just to keep an eye out for any bearish move
as i said before..we are making decisions with incomplete information.the more that can be obtained the easier to make these entires and exits

It's certainly interesting to see the confluence of another charting method/methodology with the methodology outlined in this thread and I concur with your general thoughts expressed above, although I think that we actually make trading decisions with the information available to us and that makes up our trading edge....to this extent it is not incomplete and any additional information over and above that that we look at to ascertain whether our trading edge is present may run the risk of analysis paralysis perhaps. This said, and for example confidence in a re-entry set-up after a pullback in a strong trend (created by the reaction to data releases like the weak u.s stuff) will probably be higher?

G/L
 
Top