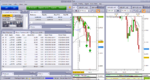
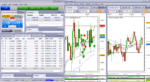
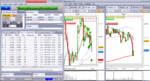
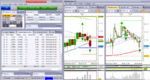
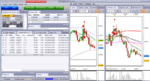
That's FXCM's "trading history". They don't seem to have history with actual entries and exits, so green arrows are simply winning trades, red arrows are losing trades and the arrows are shown approximately at the times the trades were executed. On the 4 hr and 30 min charts below, you can see it a bit more clearly.
As I understand it, Pyramiding is adding to a winning position, while I will do that occasionally, that's not usually how I trade. Most of my trades are scaling in as price goes against me, allowing me to get better prices and improving my average entry price significantly.
I call it scaling in (and out), some call it averaging in......when done improperly, it's called adding to losers.
It's a strategy that can be very powerful when used properly - see pg#15 post #118 of this journal.
Any how, as this account grows, I'm working on increasing my position size so I can continue making my goal of 2% per day.