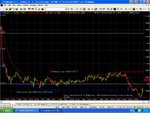
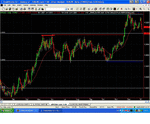
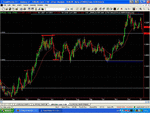
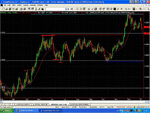
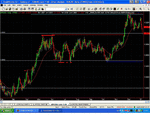
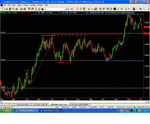
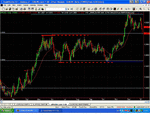
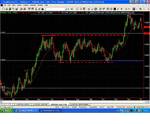
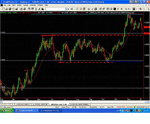
Buy @ support, selling @ resistance, selling @ minor resistance, buy @ minor support

JTrader

Guest
Messages
5,741
Likes
507
long @ support (S), short @ resistance (R), short @ minor R , long @ minor S

Hi

I'm putting this thread in forex, as i trade spot EURUSD, and so thought i may get a better/more relevant response than in the technical analysis forum.

It seems to me that there are a few ways that you can trade when support and resistance levels are hit by price.

You can look to trade a reversal, by buying @ support (S) and selling @ resistance (R).

You can also look to trade a breakout/momentum price continuation above or below S or R by selling @ minor R (once the nearby support level has been broken), or buying @ minor S (once the nearby R level has been broken).

Buying @ S or selling @ R.
1. You can either buy or sell when price hits that S or R level, hoping that a reversal will occur.

2. You can also wait for price to hit the S or R level, stall or bounce off that level showing signs of an imminent reversal, before buying or selling if the S or R level is hit again by price, hoping that a reversal will occur.

Buying @ resistance/minor support, selling @ support/minor resistance.
1. Particularly if momentum is strong/picking up speed, you can buy (go long) when price breaches the R level, and that former R level may then become minor S, hoping that a breakout/continuation up will occur.
Likewise, you can sell (go short) when price crosses/breaches the S level, and that former S level may than act as minor R, hoping that a breakout/continuation down will occur.

2. you can also look to buy (go long) when price breaches the R level, and that former R level may then become minor S, but wait for the price to retest that former R/potentially new minor S level before entering the trade, hoping that a breakout/continuation up will occur.
Likewise, you can sell (go short) when price crosses/breaches the S level, and that former S level may than act as minor R, but wait for the price to retest that former S/potentially new minor R level before entering the trade, hoping that a breakout/continuation down will occur.

Whether or not you are planning to make a reversal trade @ S/R, or make a breakout/momentum continuation trade, if S/R is broken, the following can apply -

1. If you enter the reversal trade when S or R is initially hit by price for the first time, sometimes that S or R level will fail and your SL will be hit.
2. If you enter the reversal trade after support has been hit, waiting for the price to stall/bounce off and then back to S/R before entering the trade, sometimes you will have missed the boat and not get this second opportunity to enter the trade, as the first bounce off S/R was successful. Or, you enter on the second bounce off S/R, and a win loss or draw is the trade outcome

3. If you enter a momentum continuation/breakout trade when S/R has initially just been breached for the first time, sometimes price will continue in your favour immediately, or retrace to within the old S/R level and hit your SL.
4. If you only enter a momentum continuation/breakout trade when S/R has been breached, and then you wait for a retest of/retracement to the former S/R = potentially new minor R/ minor S level to occur before entering the trade, you will either have missed the boat, as the first breach of S/R led to the momentum continuation, or you will get that 2nd opportunity to enter the trade, and a win loss or draw will be the trade outcome.

When you miss the boat on a trade, you can accept that you've missed the boat, and wait for the next trade entry opportunity. The some tempting opportunity is to enter late, once some of the profit has been missed, hoping that the reversal turns into a significant swing, or the momentum breakout turns into a trend, enabling you to still bag a healthy profit.

However, by entering trades connected to S/R late and at a less favourable entry price, you may often find that just as you enter the price stops moving in your chosen direction, reverses, you have already missed the available profit, and you end up getting stopped out.
Whatsmore, because you entered the trade late, your SL is not protected behind S/R or minor R/S and you get stopped out. The price may then retace back to the S/R level or minor R/S level, and then reverse back in your favour/chosen trade direction. If you had entered on time initially, closer to the S/R level in question, your SL wouldn't have been hit because it was protected behind S/R or minor R/S, and you remain in the trade.

Further issues
I'm really trying to find the best way to handle these situations.

There are advantages to entering on the first bounce, or waiting for the second bounce.

There are also advantages in entering a trade late/being hesitant in that because you were uncertain of what to do, you were waiting for "just that those few extra bits of info" that'd enable you to make an informed and successful decision ;) .
While the negative aspect of being hesitant is that if you enter the trade, you enter the trade late and at a less favourable price.
The positive aspect of being hesitant is that your hesitancy keeps you out of some trades that then start to fail, and if you had been decisive and entered the trade, you would have taken a loss...........
To be continued.........
 
Last edited:
Yesterday, post employment report was a good spot EURUSD example, of some of the issues that I raised in the previous post.

Following the intial 80+ pip fall, there was strong support @ 1.3000, as an alert trader may expect.

Price entered a range of between 1.2995 - 1.3110-15, where it would have been able to trade these swings from S - R and make a profit.

However, some traders, would not have felt comfortable trading these swings from S/R, and may have been waiting for S @ 1.3000 to start collapsing, and a significant momentum breakout down to occur.
While this did not result, if traders taking such a stance, had gone short early (bang on 1.3000), there were 2 opportunities to bag a small handful of pips, between 13:45 and 13:50.

However, some traders (including me :eek: ) who wanted to trade a momentum breakout below 1.3000, traders wanting the price to collapse, who were also hesitant/unsure and ended up entering these short trades late (entering @ 1.2996-1.2992 when an early entry should have got them in at 1.3000-1.2999) because they were sucked into waiting for those extra tiny bits of info that would have made all the difference to the outcome of their decision ;). These traders will have soon realised that they entered short too late, and that they had entered short @ S and price was now turining against them.

Eventually at 15:53 price moved below 1.3000 fairly easily, and dipped lower below 1.3000 than it had done between 13:30 -14:15, having stayed above 1.3000 from 14:17 up until 15:53.

As I've said, I'm just wanting to try and gain insight so that I can interpret and react to these situations better. Hopefully being able to identify things that will make me choose a correct entry price/moment more often.

All feedback and help is welcome.

Thanks a lot
jtrader.
 

Attachments

  • EURUSD post NFP 5-1-6.JPG
    EURUSD post NFP 5-1-6.JPG
    141.2 KB · Views: 554
Last edited:
jtrader said:
Following the intial 80+ pip fall, there was strong support @ 1.3000, as an alert trader may expect.

Why would an alert trader expect that?

Price entered a range of between 1.2995 - 1.3110-15, where it would have been able to trade these swings from S - R and make a profit.

Not necessarily. Couldawouldashoulda is nothing more than the barest beginning to possibilities that only might be worth investigating and researching. Only when that work has been translated into rules and procedures can one sigh over what he "would have been able" to do had he followed those rules. Otherwise he can spend years wandering off down dead-end streets.

However, some traders, would not have felt comfortable trading these swings from S/R, and may have been waiting for S @ 1.3000 to start collapsing, and a significant momentum breakout down to occur.

However, some traders (including me :eek: ) who wanted to trade a momentum breakout below 1.3000, traders wanting the price to collapse, who were also hesitant/unsure and ended up entering these short trades late (entering @ 1.2996-1.2992 when an early entry should have got them in at 1.3000-1.2999) because they were sucked into waiting for those extra tiny bits of info that would have made all the difference to the outcome of their decision ;). These traders will have soon realised that they entered short too late, and that they had entered short @ S and price was now turining against them.

What individual traders may or may not want price to do is irrelevant to the task. Beyond that, however, hesitancy and doubt are the result of (a) not knowing what to look for and/or (b) not knowing what to do with it when whatever is looked for appears. This goes back to research and rules.

As I've said, I'm just wanting to try and gain insight so that I can interpret and react to these situations better. Hopefully being able to identify things that will make me choose a correct entry price/moment more often.

You are right to characterize price movement as the result of what traders are doing rather than as abstract and independent dots on a page or digits on a tape. Otherwise, the whole notion of S&R is pretty much meaningless. It is an understanding of what traders are likely to do at these levels that makes rules and strategy possible.

However, it is unrealistic to expect the sort of behavior that creates profit opportunities at levels that are trivial or even meaningless. The fact that one labels a certain level as support does not make it so. If it isn't so, then whatever one does there is nothing more than a guess and a gamble. You therefore have to ensure that whatever you've labelled as S&R truly are S&R. Once you have, then you can begin to take a studied approach to what happens at those levels and to what you can do to profit from what happens, even if "doing" means nothing more than waiting for a better opportunity.

PS. Post a chart of the past year's price movement and I'll provide specific examples of S&R.

Db
 
Last edited:
Quote:
Originally Posted by jtrader
Following the intial 80+ pip fall, there was strong support @ 1.3000, as an alert trader may expect.


Why would an alert trader expect that?

Thanks DBP

what I mean is, yesterday, perhaps naively, I hadn't considered that price might behave differently @ 1.3000 to have it may behave @ 1.3100 or 1.3200. 1.3000 is a whole digit, therefore it does seem logical to me that S may form their, and be strong, but if this S was to fail, panick selling may see price fall dramatically below 1.3000. However, for this to have happened yesterday, something would have needed to trigger sellers to panic, and/or bidders to start withdrawing their orders to buy from the order book.
Therefore, an advanced/experienced trader would probably have thought that strong S is perhaps more likely to form at 1.3000, than at 1.3100, 1.3200, 1.3150 etc. the entury and half century levels in forex where price tends to hesitate, reverse, or collapse. While a novice on the other hand may not have even considered that 1.3000 is a whole/round century level, with 1.2999 1-pip below.

Until my second attempt @ shorting below S @ 1.3000, yesterday it had not occurred to me that 1.3000 was, like say 1.3500, 1.2500 or 1.4000, a round and therefore major century level that some traders may or would want to protect fiercely.

I have gotten used over the last couple of weeks to picking up pips when century levels or half century levels give way, then momentum picks up and I am in a quick profit. However, this has been at levels such as 1.3100, 1.3150, 1.3200 and not 1.3000.

I also noted earlier on yesterday, prior to 1330, that I had on a couple of occassions traded @ S/R hoping for a reversal, but had got on later than I could have, once some of the potentail profit from the S/R price had been missed.
This did not however stop me doing the same thing 3 times between 1340-1350 :eek: :rolleyes: :mad: on the assumption that S was giving way, and a momentum breakout and possible price collapse was imminent.

The reason I am entering late, as I think you suggested before, is that I am unsure and I keep waiting for that one extra bit of info that will lead to me making a good decision i.e. yes, the price is falling below S, or yes, the price is reversing at R. The trouble/tendency is, by the time I decide, yes I should have shorted @ R, or yes, I should have shorted below S, the price has already moved, I enter late, I have missed some of the available profit.

More than 50% of the time I have got my timing spot on, but as seen as I've only been doing this for a few weeks, is hard to make a judgement.

Yesterday i told myself that I need to go with my instincts and enter @ or very close to S/R on a reversal opportunity. And at or very close to broken S/R on a momentum breakout trade.
The reason I hesitate is because I fear I may be completely wrong - shorting when the outcome shows I should have gone long, and vice versa, hence the late entries, when I see that my instinct/hunch turned out to be correct.
 
Perhaps just the experience of observing live price action, and building up a memory bank of more types of price behaviour is what I lack most. Because as it is I am thinking, well i did A because I was expecting B to happen, but didn't realise that F might be the result, as I not seen F happen before.

Part of my problem @ missing reversal opportunites, or entering late when looking for a reversal at S/R, is because, so far, I have only really looked to trade breakouts from S/R levels and have not really felt that comfortable trading reversals @ S/R (unless my indicator gave me a signal to).

Today my modified rules from the lesson learnt yesterday would be to have the courage to go with my instincts and enter trades @ or very close to S/R - whether looking for a reversal or a breakout, instead of waiting. However, I just seem to fear ending up on the wrong side of the trade, and making a losing trade - hence the late entries, missed entries, and missed profit opportunites.

However, like I said, there are times when I hesitate, don't enter the trade, and then am glad that I didn't enter the trade, as the price went against the direction i would have chosen.
 
Last edited:
Today my modified rules from the lesson learnt yesterday would be to have the courage to go with my instincts and enter trades @ or very close to S/R - whether looking for a reversal or a breakout, instead of witing. However, I just seem to fear ending up on the wrong side of the trade, and making a losing trade - hence the late entries, missed entries, and missed profit opportunites.

The last thing you need to be doing at this point -- or at this level, if you will -- is to go with your instincts.

Take a deep breath and post a chart of the last year's activity.
 
dbphoenix said:
The last thing you need to be doing at this point -- or at this level, if you will -- is to go with your instincts.

Take a deep breath and post a chart of the last year's activity.

This daily chart shows the last 11 months. The bar spacing seemed to close on the 12 month chart.

Thanks.
 
Last edited:
This daily cart show the full 12-months, but with tight bar spacing.
 
Last edited:
Hi DBP

just to mention, I have recently read the whole of your "mirror of the erised" and a large chunk of your "price, (volume, support, resistance, demand, supply" threads...
 
Three tasks.

1. Read charts from left to right, not right to left.

2. View every potential trade in at least two timeframes. This helps to put the potential trade in context. Think of these timeframes as a "trend" chart and a "trading" chart.

3. Include only what is absolutely necessary to your trading decision. For example, if you're using candles to make your decisions, fine. If not, lose them.

This particular chart is pretty straightforward.

Note that price has been in an uptrend during the time framed by this chart. This is your "universe". Within this universe, price was in a well-defined range for seven months. This is not trivial.

But to begin at the beginning, price moves up to a point at which it stalls (if you want to know why, you'll have to extend the timeframe) after a month-long and uninterrupted advance. It retraces, then tests the previous high. That level holds and establishes itself as R.
 

Attachments

  • Image1.gif
    Image1.gif
    146.8 KB · Views: 509
After this double top or match top or whatever you want to call it, price falls to preliminary support.
 

Attachments

  • Image2.gif
    Image2.gif
    147.5 KB · Views: 395
Price then drops a bit further to a new preliminary support level.

Are you in a downtrend? You have a "lower high".

But do you have a lower low?

If you think you might, and you're aggressive enough, you'd want to short the lower high. However, you'd also want to get out quickly if the lower low didn't materialize.

Or you could wait for the break through "S", which is much more obvious and thus carries more risk.

(You may have read Justin Mamis, in which case you are familiar with his three types of risk: price risk, information risk, time risk. Or maybe you figured this out on your own. But every trader, whether he is conscious of it or not, has to do a balancing act with these three types of risk. You are struggling with price risk vs information risk, but you at least understand that if you want less information risk, i.e., you want to "know more" before pulling the trigger, you must assume a greater price risk, i.e., you won't be getting in at the most opportune time.)

In this case, price hardly qualifies as a lower low before it rallies, but unless you're looking for laser-like precision, considering this as a support "zone" is sufficient.
 

Attachments

  • Image3.gif
    Image3.gif
    147.7 KB · Views: 388
Price then makes a more "important" lower high (more important because this test of R took more time and effort). And if you consider that last low to be a lower one rather than just a test of the one before that, you can short this.

Whether you do or not, price falls back to test S. However, it falls past the first lower low and hits the brakes at the second. This makes the second more important and the S level to which you should likely pay more attention.
 

Attachments

  • Image4.gif
    Image4.gif
    147.1 KB · Views: 409
Last edited:
Since price doesn't make a lower low, at least not yet, you still don't have a downtrend. So you can either hope for one, or exit your short if you took it.

Price then tests the immediately preceding high and you most likely would already have extended your R line. Price chokes at that immediately preceding high -- or minor R -- rather than the more major R just above, and if you consider that last low a lower low, you may want to short this as well. If you do, there are ways of playing this that would reduced your price risk, but you'd have to have very definite rules to manage the trade. Otherwise, the subsequent waffling over the next month, going essentially nowhere, would not only tie up your stomach in knots but entail time risk.

Note that there're no lines drawn at the more minor "lower highs" because of the fact that they are minor. But if you want to trade them, nobody's stopping you.
 

Attachments

  • Image5.gif
    Image5.gif
    147.4 KB · Views: 432
Now, after repeated efforts to reach R, price tests S again. And it remains good.
 

Attachments

  • Image6.gif
    Image6.gif
    147.5 KB · Views: 374
And here the rubber meets the road. Price is looking to take on R once again. No intuition is required to note that bozo (the long bar extending itself toward R with a close at or near its top), but experience (whether in real time or through studying old charts) is needed to assess the probabilities of breaking through R or reversing back toward S.

"Risk" is also a factor, but if one carefully plans the trade and determines what exactly he is going to do if he buys the breakout and price reverses, or he sells the reversal and price resumes its advance, or price does both, or neither, then he has no reason to fear whatever price decides to do. He's covered.
 

Attachments

  • Image7.gif
    Image7.gif
    147.7 KB · Views: 291
And now you can more "intelligently" determine what ought to be done with any post-1.30 trade.

Are you still in an uptrend? If not, where was the reversal? Why is it a reversal? If it meets all your criteria for a reversal, why not short there rather than wait? If it doesn't, what are your criteria for exiting the long you may have taken at the break thru R?

Are you now in a downtrend? If so, where's the low that your lower low is lower than? If you're not in a downtrend, why short? What are your criteria for going long?

If no trade at all was taken, one can at least see at least a possible reason why price has stopped where it has. And if one had shorted at any point, he'd see why he ought to at least consider covering it and even consider buying.
 

Attachments

  • Image8.gif
    Image8.gif
    145.7 KB · Views: 295
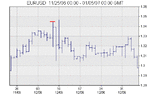
Now let's say your world began around Thanksgiving (end November). You're interested in shorter-term trading. You may even be a scalper. However, the major trend is still of importance in terms of the probabilities that your trades will move in the direction that will result in profit for you.

Here you make a high and preliminary R.
 

Attachments

  • Image1.gif
    Image1.gif
    10.7 KB · Views: 306
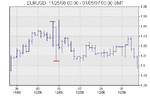
Now you make a low and preliminary support. You're beginning to define your universe, or your "trading environment" (or whatever).
 

Attachments

  • Image2.gif
    Image2.gif
    10.7 KB · Views: 258
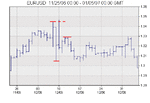
There is a test of "R" and it holds, making its importance more likely. Price works its way toward the previous low, pulls up short, and makes what is for the moment a lower high. This helps to define a potential downtrend in this timeframe.
 

Attachments

  • Image3.gif
    Image3.gif
    13.3 KB · Views: 279
Top