You are using an out of date browser. It may not display this or other websites correctly.
You should upgrade or use an alternative browser.
You should upgrade or use an alternative browser.
ArabianNights posted a link the official Eurex circular: http://www.eurexchange.com/download/documents/circulars/cf0672009e.pdf
What do you think will change when BOBL goes back to 0.1 tick on May 11?
What do you think will change when BOBL goes back to 0.1 tick on May 11?
Last edited:
ArabianNights posted a link the official Eurex circular: http://www.eurexchange.com/download/documents/circulars/cf0672009e.pdf
What do you think will change when BOBL goes back to 0.1 tick on May 11?
Paul Rotter, ake the Flipper, will start trading the BOBL again ... prepare yourself to lose a lot of money.
Paul Rotter, ake the Flipper, will start trading the BOBL again ... prepare yourself to lose a lot of money.
I doubt it. He never actually traded much in the BOBL when it was full tick. He said he mainly used the bobl and schatz for hedging.
spreader_legger
Well-known member
- Messages
- 447
- Likes
- 38
I thought he was primarily a scalper. Did he hold some of his positions for longer then?
I doubt it. He never actually traded much in the BOBL when it was full tick. He said he mainly used the bobl and schatz for hedging.
I thought he was primarily a scalper. Did he hold some of his positions for longer then?
Yes, he was a scalper and I don't think he was holding positions for longer. I obviously don't know exactly how he traded, but that's what he said in the Trader Monthly article "Flipping Out": “I didn’t trade the boble and the schatz that heavily; I used them mainly for hedging purposes.”
Skill Leverage
Experienced member
- Messages
- 1,316
- Likes
- 186
He would need a completely new strategy now; size seems to be treated with severe scepticism these days.
P.S Did anyone see the guy getting whacked on the Bund for ~2k lots after dicking around on Friday morning before the ass fell out of it? Tres amusing watching him trying to get out of it.
P.S Did anyone see the guy getting whacked on the Bund for ~2k lots after dicking around on Friday morning before the ass fell out of it? Tres amusing watching him trying to get out of it.
He would need a completely new strategy now; size seems to be treated with severe scepticism these days.
He is still in the game: Rotter Invest - ASSETMANAGEMENT
Don't know what he is doing though nowadays.
pnf-trader
Junior member
- Messages
- 13
- Likes
- 0
Hello,
I am new to Bund trading and am very happy to see other traders here, also.
Before trying to trade the Bund, I have been primarily trading Forex and CFDs on commodities, stocks and indexes.
It was a few weeks ago, when I met a successful Bund trader, who made me curious about the Bund and I gave it a try.
What I like the most about it, is the low volatility compared to Forex trading. What the Bund makes in ticks a day, the GBPJPY or other pairs make within a few minutes sometimes.
My approach in trading the Bund is very simpel and straightforward:
I am using Point & Figure charts with trendlines and one moving average to determine buy and sell signals. Additionally, I have pivot points added on my chart to see areas of support and resistance, where I tighten the stop loss.
I am a daytrader, looking to make 10 ticks per day. I will not hold a position overnight.
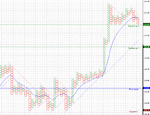
Attached is a screenshot of todays price action. One box equals 2 ticks, reversal amount is set to 2. This is a Bund CFD, not the Bund Future. I am not yet willing to trade it with huge amounts of capital, before I have been tested my approach for a few months first. The spread is 3 ticks - compared to the spread and commission in futures trading, that's bad. But the advantage is, that I can trady fractals of the standard contract size.
Attachments
Last edited:
Attached is a screenshot of todays price action. One box equals 2 ticks, reversal amount is set to 2. This is a Bund CFD, not the Bund Future. I am not yet willing to trade it with huge amounts of capital, before I have been tested my approach for a few months first. The spread is 3 ticks - compared to the spread and commission in futures trading, that's bad. But the advantage is, that I can trady fractals of the standard contract size.
Nice chart. I don't understand why you trade the CFD though. Costs are huge compared to the future. And you don't need "huge amounts of capital" to trade the Bund Future. Intra day margin with most brokers is less than 500EUR per contract. You will get more realistic fills tradig on a simulator using market orders than trading this Bund CFD.
Paul Rotter, ake the Flipper, will start trading the BOBL again ... prepare yourself to lose a lot of money.
I found these articles recently. You could call him the Paul Rotter of the Bobl. Trades 25k round trips per day (about 10% of daily volume) and he is only 25.
Attachments
arabianights
Legendary member
- Messages
- 6,721
- Likes
- 1,380
pnf, can you explain the charting system you're using? I'm taking it's a noise filtered up and down tick kind of thing... looks bloody useful to me
I thought he blew up?
Who blew up? Lawrie Inman?
pnf-trader
Junior member
- Messages
- 13
- Likes
- 0
pnf, can you explain the charting system you're using? I'm taking it's a noise filtered up and down tick kind of thing... looks bloody useful to me
This type of chart is called Point & Figure charts. It's mentioned in many books out there, even in John Murphy book about technical analysis of the financial markets. A good source to start with is here:
StockCharts.com - Point & Figure Charts
and here are some of the chart patterns you can look for, to make your trading decisions:
StockCharts.com - P&F Pattern Alerts
If you also take trendlines, which have (almost) alway 45 degrees in Point & Figure charts, you get a good overview of the market and can filter out some bad trades. Beside that, I have included a moving average, which can also be applied to P&F charts. A sell signal above the MA will be ignored, a buy below the MA also.
And you're right, the P&F chart acts kind of like a filter. Only 'big' price movements will be plotted on the chart. How big this move is, is defined by your box size - in my previous screenshot it was a box size of 2 ticks. And a reversal of the price movement (changing from rising prices, symbolized by X's, to falling prices, symbolized by O's) will only be drawn, after a given reversal amount. In my case this was also 2 - so only if price falls 2 times the box size (=4 ticks), a new column will be plotted.
So P&F charts are solely based on price movements and don't take the time into consideration - the only thing you know about time is: on the right hand side of the chart happend later than on the left hand side.
By adjusting box size and reversal amount, you can make the chart react more sensible to price movements or only take big moves into account, if you use bigger box sizes and reversal amounts. This also defines your time horizon for the trade. A 2 x 2 setup can be used for daytrading, while a box size of 10 ticks would result in a lower trading frequency and you would keep positions opened for a longer period.
For those of you who are interested, I have attached the current chart with 2 ticks, 5 and 10 ticks box size. Reversal is still 2 boxes - though a reversal of 3 is the common standard. But a reversal of 2 gives more signals and allows tighter stop losses (I put the initial stop loss right below a given signal).
Attachments
Last edited:
arabianights
Legendary member
- Messages
- 6,721
- Likes
- 1,380
This type of chart is called Point & Figure charts. It's mentioned in many books out there, even in John Murphy book about technical analysis of the financial markets. A good source to start with is here:
StockCharts.com - Point & Figure Charts
and here are some of the chart patterns you can look for, to make your trading decisions:
StockCharts.com - P&F Pattern Alerts
If you also take trendlines, which have (almost) alway 45 degrees in Point & Figure charts, you get a good overview of the market and can filter out some bad trades. Beside that, I have included a moving average, which can also be applied to P&F charts. A sell signal above the MA will be ignored, a buy below the MA also.
And you're right, the P&F chart acts kind of like a filter. Only 'big' price movements will be plotted on the chart. How big this move is, is defined by your box size - in my previous screenshot it was a box size of 2 ticks. And a reversal of the price movement (changing from rising prices, symbolized by X's, to falling prices, symbolized by O's) will only be drawn, after a given reversal amount. In my case this was also 2 - so only if price falls 2 times the box size (=4 ticks), a new column will be plotted.
So P&F charts are solely based on price movements and don't take the time into consideration - the only thing you know about time is: on the right hand side of the chart happend later than on the left hand side.
By adjusting box size and reversal amount, you can make the chart react more sensible to price movements or only take big moves into account, if you use bigger box sizes and reversal amounts. This also defines your time horizon for the trade. A 2 x 2 setup can be used for daytrading, while a box size of 10 ticks would result in a lower trading frequency and you would keep positions opened for a longer period.
For those of you who are interested, I have attached the current chart with 2 ticks, 5 and 10 ticks box size. Reversal is still 2 boxes - though a reversal of 3 is the common standard. But a reversal of 2 gives more signals and allows tighter stop losses (I put the initial stop loss right below a given signal).
Thanks, this looks pretty interesting as it seems to be diagrammatic of how I trade (more or less) - I'll see if I can do them on Reuters or CQG...
pnf-trader
Junior member
- Messages
- 13
- Likes
- 0
Using P&F charts has dramaticaly changed my trading style - to the positive. I get clear signals and good market overview. I trade less frequently than before and have eleminated over-trading... Give it a try and let us know if it works out for you 👍Thanks, this looks pretty interesting as it seems to be diagrammatic of how I trade (more or less) - I'll see if I can do them on Reuters or CQG...
If you're looking for a charting package, I have just updated this thread: http://www.trade2win.com/boards/brokerages/49842-charting-packages.html#post772234
But maybe you start with drawing it by hand, first. It's a great lesson and you get a feling for how those type of charts work.
pnf-trader
Junior member
- Messages
- 13
- Likes
- 0
Nice chart. I don't understand why you trade the CFD though. Costs are huge compared to the future. And you don't need "huge amounts of capital" to trade the Bund Future. Intra day margin with most brokers is less than 500EUR per contract. You will get more realistic fills tradig on a simulator using market orders than trading this Bund CFD.
Sorry, I have missed your response.
You're right, the intraday margin is low for the Bund future. But the tick value of 10 Euro is high, compared to the 0.1 or even 0.01 lots I can trade with my CFD broker.
So having a 8 tick stop loss would result in a 80 Euro loss, instead of an 8 Euro loss. As long as I am still in a learning phase, this is too much for me and I will stick to the CFD. But the goal is, to end up trading the Bund future once in a few months.
But aside from the low intraday margin for the Bund future, the minimum funding of an account often starts at $10.000 (Interactive Brokers). My broker offers accounts beginning at 250 Euros. Combined with mini and micro lots, that's perfect for testing new systems - in my opinion.
Ted Spread Jobbing Euribor vs Schatz
Hi, new to this forum. I have recently begun trading the european ted spread, Euribor vs Schatz but would like to know if anyone has any advice on how you job around the ted spread when it goes offside. I understand that more often than not the usual strategy is to average the price of the ted as it goes offside as you expect it to come back. But how exactly do you job around the ted? Is jobbing just a case of skillful averaging, ie do you double your limits on the euribor leg for instance an wait for a certain price on the schatz, rather than just simply buying the ted at 16's when you already bout it at 19's so that your now in at 17.5
I use 4 by 5 lots and have 5 clips at my disposal but up until now have only used them to average and then hold the average price waiting for it to come back onside.
Any advice on this would be very helpful.
Thanks, Dave.
Similar threads
- Replies
- 1
- Views
- 5K
- Replies
- 8
- Views
- 7K


