Its hard to believe than ward nets are so efficient in learning comparing to MBP, i think there must be some price for this in Ward nets, they just made NS2 and Predictor to be able to use with PCs made 10 years ago.
Krzysztof
Ward nets are not magic. I think NS2 stops training when RMSE on validation set starts to increase. This usually avoids over training (curve fitting) and improves generalization. You can do the same with MBP, if you split data sets into 3 parts, (Train, Test, OOS) and use train and Test in MBP, then train until Test RMSE begins to increase (too bad you must do this manually, it should be added as a feature) then you have training like NS2 and NSDT, and it will be very quick since epochs will be few. Then you save code and use it to test performance on OOS set (Doing this in MBT would be another desirable feature).
Training for many epochs very often decreases performance on OOS, because it is overtraining on Train set and can curve-fit if many weights are available.Then net will not generalize as well. This is a major problem with NN's.
Two solutions: Use a Validation set as above, and/or use as few weights and many data samples as possible.
Regarding SS. For my EURUSD NSDT prediction it was shown around 50%, hope its calculated the same way like i did. I think usefull value would be like > 60% and with target of 80%. i dont know if it is possible but if we train till very low RMS SS should start to improve drastically. Also SS increases when sample size decrease but i dont know what will happen to RMS in this case. So in next stage i will cut training size by 2 to 10k bars
Krzysztof
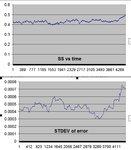
In your analysis of the MBT trained net (15-30-xx-report.xls) you have an SS of 0.435748599. That suggests that if the signs were reversed for each output, the SS would be ~.564, which is approaching 60%. However, the sign inversion makes me think that something funny is going on here. Maybe the result is just luck. Here are curves from the data in 15-30-xx-report.xls for the SS averaged over 500 samples and the rmse averaged over 500 previous samples.

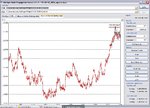
You can see that the SS is changing only at the end. The RMSE changes also at the end, going from about 4-5 pips to ~ 7 pips at the end. This indicates non-stationarity, and suggests that we need to look at other data. When I first posted this data, I was trying to replicate Arry's post (4, I think), and did not mean that we should study it so closely. I thought then and continue to think that we should look at a more stationary set of data. The data set we are using has values in the OOS set that do not occur in the Train set. If you teach a child the alphabet from A to M, you cannot expect him to recognize the letters X, Y, Z. Nets are a lot like children. You must train them with data that covers all possibilities. This requires stationary, or quasi stationary data such as the first differences of prices, or else it requires painstaking effort to be sure that the training set is truly
representative of all data that might be encountered.
I will post a data set that is quasi stationary when we are done with this if you all want one.
MadCow


