You are using an out of date browser. It may not display this or other websites correctly.
You should upgrade or use an alternative browser.
You should upgrade or use an alternative browser.
Build Neural Network Indicator in MT4 using Neuroshell
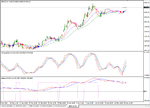
I just completed my own research to display stock data on Metatrader 4.
These stock data and group symbols are NOT AVAILABLE on the original MT4 broker version. All daily data source are taken from yahoo finance.
I have succeed to display several stock symbols from IDX (Jakarta Stock Exchange) and display them in MT4 Alpari-UK..afterward I can play with my indicators and use as my new weapon to analyze Stock....😀
Attachments
arryex , can the data display into chart in realtime?
hello all, anyone know any infos about the indicator for nsdt - DT_ssa ? all I know is it's a repaint indicator from fxreal which i can not access to now. anyone got the source of DT_ssa.dll or the way to contach with the author?
hello all, anyone know any infos about the indicator for nsdt - DT_ssa ? all I know is it's a repaint indicator from fxreal which i can not access to now. anyone got the source of DT_ssa.dll or the way to contach with the author?
Hi Nix,
Everything done offline, otherwise all settings will be overwritten with original MT4 configuration. Currently for Indonesian stock I have only daily data available from yahoo. Here I exported also manually data from one broker for hourly chart, there is possibility to connect MT4 to other real time data feeder.
If you want to trade for International Stock (US, Germany, UK) and free data feeder, I know you can use alpari or other broker which provide those data and trading facility.
Regarding DT_ssa, I found the mq4 version (no dll), I do not try if this is repainted or not. You may also convert the code into dll if you want to use it in NSDT.
Attachments
it's been a long time I check this thread
I can confirm that arry's trading result was genuine. I met him occasionally. He started with $10,000 deposit (not cent account, it was full dollar account) and ended up with more than 100% gain. I know his broker and I trade with the same broker too.
I believe many of his fellow traders suggested him not to expose his profitable systems. But definitely he agree with me on one thing:
The exact phrase that I suggested him was: "Keep the losers on the losing side". The more loser means greater profit potential. Sounds cruel but in fact it is the reality.
There is nothing wrong with me. Ok, I jumped into conclusion a bit fast. I did not realize that it was not your account. I have to apologize for that. My original skepticism is based on the near perfect record you reported.
Nevertheless you have to agree that the possibility to fake an equity curve is real and that the only way to sort it out is to have access to the list of your opened positions.
I can confirm that arry's trading result was genuine. I met him occasionally. He started with $10,000 deposit (not cent account, it was full dollar account) and ended up with more than 100% gain. I know his broker and I trade with the same broker too.
I believe many of his fellow traders suggested him not to expose his profitable systems. But definitely he agree with me on one thing:
arryex said:Keep looser always sitting in other side ...and the winner no need to care...
The exact phrase that I suggested him was: "Keep the losers on the losing side". The more loser means greater profit potential. Sounds cruel but in fact it is the reality.
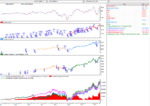
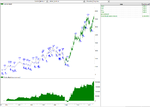
Here implementation of NS2 indicator on NSDT on stock,
First I create non-optimized trading strategy using NS2 indicators in several stock, then I can choose which one most profitable trade.
I built comparison between 4 strategy based on predicted MACD:
1. non optimized (using original NS2 indicator)
2. optimized parameters
3. create prediction based on NS2 indicator
4. buy and hold trading strategy
Due to nature of stock trading at Jakarta stock exchange, only Long entry & exit allowed (no short), 1 lot = 500 share, and broker cost parameter added.
Attachments
10 years on the EURUSD 1440. three-layer perceptron nonlinear configuration 100-5-1. 100 bars are used during the training. Test sample no. 500 epochs.
output AC (1,2,2) for 1 value ahead. Simple trading rule: OUT[0] > 0 = BUY POSITION and OUT[0] < 0 SELL POSITION.
output AC (1,2,2) for 1 value ahead. Simple trading rule: OUT[0] > 0 = BUY POSITION and OUT[0] < 0 SELL POSITION.
Attachments
Hi Mr. Future,
I made verification between your indicator (modified accelerator) and original accelerator.
Seems for EURUSD daily the modified indicator almost delay 1 bar compare to original one, i.e. the original AC change from negative to positive and from positive to negative is one bar earlier than modified one.
I will check the prediction result with original indicator afterward.
Attachments
Similar threads
- Replies
- 24
- Views
- 34K
- Replies
- 5
- Views
- 4K


