Boot's Trading

bigbadboot

Member
Messages
57
Likes
1
Hello there!
I'm going to be using this thread to test a trading system I have developed (developing).
I'm not really going to go into the details of the system so this might not be of much use to anyone, but I will be posting the set-ups the night before. The system itself isn't particularly complicated and is basically a trend following system. I will be showing trades on FTSE350 shares (mainly FTSE100) both long and short trades. I will have stop and limit price targets or close the trade in 5 trading days if the targets are not reached.
I have backtested the system to January 2003 and intend to use this thread to forward test it. Most of the trades I will NOT be using real money but will be using Fantasy Share Trading, Spread Betting and CFD Trading Game to paper trade.

Ok here goes:
Trades for Monday 8th December 2008:-

Long:
No trades

Short:
JMAT @ 993.2; Stop 1030; Limit 799
WMH @ 210.5; Stop 220; Limit 170
ITV @ 37.2; Stop 40; Limit 32
LGEN @ 75.0; Stop 90; Limit 62

The above trades are in order of preference. Usually most of these trades wont get filled and should be left as orders until the end of the trading day then cancelled.
I'll give an update on Monday evening. Should anyone have any questions please ask. I might answer.
 
One thing I forgot to mention was the bet size on these trades. To determine this i will use the LOWEST result of the following formulas:-

(%risk/(Difference between stop and entry in points))*Capital

or

(Capital*%risk)/(Entry price*%risk)

Where: %risk = amount willing to risk on the given trade (eg 1% or 2%)

In most cases the first formula will be used but in trades where the stop-loss is very close to the entry price then the second formula will be safer.

So for example on the JMAT trade with £10,000 starting capital and a 2% risk gives the following results for a 993.2p entry and 1030p stop:

(2%/(1030-993.2))*£10,000 = £5.43

or

(£10,000*2%)/(993.2*2%) = £10.07

So using the LOWEST value of £5.43 means a bet size of £5 per point.

That will give the following for the above trades:
JMAT £5pp
WMH £21pp
ITV £71pp
LGEN £13pp

I'll give an update on the close today unless I think of anything in the meantime.
 
Ok here's an update of today's trades- all short (I'm using prices from etrade)

Stock Entry price Close £pp P/L Status
JMAT 993.2 955.0 £5 £191.00 Open
WMH (Trade canceled, price didn't reach target)
ITV 37.2 36.9 £71 £21.30 Open
LGEN 75.0 75.4 £13 -£5.20 Open

Total +£207.10

Not a bad day. The William Hill trade wasn't entered as the price didn't reach the 210.5p target (I think the high of the day was 208.4p on etrade)
The other 3 trades will stay open for tomorrow....I'll also update with any set-ups for tomorrow later this evening.
 
Ok here's tomorrow's set-ups.
Again there are no long trades. I have a lot of signals for short trades so I have tightened the criteria. Again I have tried to place them in order of preference.

(Stock;Target entry price; Stop-loss; Limit;Bet size £pp)
AAL; 1594.8; 1800; 1163; £1pp
PRU; 373.3; 425; 259; £3pp
BLT; 1182.0; 1300; 931; £1pp
BG; 896.4; 977; 756; £2pp
WPP; 364.4; 400; 310; £5pp
AV; 404.4; 440; 346; £5pp
IHG; 551.8; 600; 494; £4pp
BT.A; 145.2; 156; 131; £18pp

Remember these are all SHORT trades. It might look like a lot of set-ups but the price targets means most will probably not get filled. The bet size is based on a £10,000 account size and 2% risked per trade.

I was thinking of adjusting the %risk on each trade depending on the strength of the signal. Eg 2% risk on a strong signal, 1.5% risk on a medium-strong signal, 1% on a normal signal, etc. However I'm only forward testing this system so I will keep it simple for now.
 
midmorning update

Yesterday's trades:
JMAT; open; 1002.5; -£46.50
ITV; stopped out; 40.0 -£198.80
LGEN; open; 80.1; -£66.30

Today's trades:
BG; open; 890.5; £11.80
AV; open; 401.5; £14.50
IHG; open; 557.8; -£24.00
WPP; open; 374.7; -£51.50
AAL; pending
BT.A; pending
BLT; pending
PRU; pending

So in total DOWN £360.80 including yesterday's trades.
 
hi bbb

My main bag is swing trading ftse100 shares so I'm quite interested in your thread. Thought you might be interested in a slightly different perspective, but don't want to put you off the system you're developing in any way.


aal - will move into swing uptrend if 1590 goes. I was short from 1470 (1/12) but out now.
av - will move into swing uptrend if 415 goes. I was short from 374 (2/12) but out now.
bg - in swing uptrend since 31/10. I'm long from 831 (24/11) and still holding.
blt - moved into swing uptrend 28/11. I would have gone long yesterday but for gap opening.
bt - on the point of moving to swing uptrend.
jmat - on the point moving to swing uptrend.
pru - moved to swing uptrend yesterday. I was short from 306 (2/12) and stoplossed out.

good trading

jon
 
Hi Jon
Thanks for your comments....I was beginning to think no one was following my thread.

Yes today my system hasn't had the best of days. I think maybe I need to filter out some of the set-ups. Basically what I am looking at is a swing trading system using simple moving averages to identify the primary trend then a short bollinger band to identify overbought/oversold conditions.

Initially I was playing about with a 100 day MA for the trend and a fixed % band around a 5 day MA (eg 5day MA +/- 5%) for the entry signal. This worked ok on some stocks but different stocks would have different levels of volatility and changing market conditions would result in very quiet periods when the channels were too wide and busy periods when the channels were too narrow. To overcome this I began experimenting with bollinger bands, using a short MA but using the standard deviations in the band stretching back over a longer period to reduce the sensitivity. Eg a 5 day MA with a 20 day standard deviation band around it. Hope this makes some sense.

I'm still developing it at the moment but thought I would start the thread to see how it performed and to see if anyone had any ideas or interest in it. I'm not trading it with any real money at the moment.

Thanks for your interest.

Adam
 
Hi again.
If you're interested I'll try and put a chart on later to illustrate what I am talking about.
 
Time to check the damage!

Trades opened on Monday:-
JMAT; 1005.5; open; -£61.50
LGEN; 84.0; open; -£117.00
ITV; [email protected]; -£198.80

Trades opened today:-
AAL; canceled
BT.A; canceled
IHG; 563.3; open; -£46.00
WPP; 382.7; open; -£91.50
BG; 920.0; open; -£47.20
BLT; canceled
AV; 423.0; open; -£93.00
PRU; 381.7; open; -£25.20

Total loss of £680.20
I'll keep an eye on these trades plus I'm going to do a bit of tweaking to the system later.
 
Hi again.
If you're interested I'll try and put a chart on later to illustrate what I am talking about.

adam

aye, stick a chart up and i'll do the same to see how things compare

good trading

jon
 
adam

aye, stick a chart up and i'll do the same to see how things compare

good trading

jon

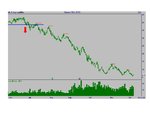
I've added (tried to add) a chart for Xstrata. It isn't a stock that I have any signals on at the moment but it does show a good example of what I am working on (I hope you don't think I am cheating using this example). The red arrows indicate entries for short positions (a break-through of the upper band). Both the bands and the moving averages in the chart are lagged so that the actual entries for those trades would have been known on the close the day before.
I have 2 simple moving averages to identify the trend. The blue channel in this example is a 5 day moving average with 2.5 times the 10 day standard deviation on each side. Obviously it's possible to change these settings. Increasing the number of standard deviations will increase the width of the band, increasing the period of the standard deviations will both smooth and increase the width of the bands.
The reason I did this is I wanted a trading channel that was faster than the standard 20 period, 2 s.d Bollinger band and simply having a 5 period, 2 s.d Bollinger band was too sensitive (the bands would expand and contract too erratically to give any decent trading signals)
I hope you like the chart. I would love to hear what you think of the basics of my system at present. I know it's a bit rusty at the moment but running the trades in this journal I am hoping I will be able to fine tune it before I trade it live.
 

Attachments

  • xstrata.bmp
    1.4 MB · Views: 160
ah, bbb - you lit on my favourite fellow :D what a corker!!

For me the swing trend turned down beginning of July (right of red arrow) when the low of the last swing low in the previous uptrend was taken out. You can see the 3+bar retracements forming swing highs (red lines) and the short entries (white lines) either for new trades or additions after the first one if you'd stayed with it throughout (you'd still be in having ridden it down from around 3717)

It'a great share and gave the same smooth ride on the way up.

We seem to be singing from a similar hymn sheet except for trend definition where I don't use moving averages (except as a filter sometimes).

good trading

jon
 

Attachments

  • xta.JPG
    xta.JPG
    49.7 KB · Views: 208
Good evening.
Here are my set-ups for tomorrow. I've managed to filter them down a bit. There are 6 short trades, I have also added a long trade but the signal wasn't very strong.
I haven't listed the trades in any particular order (actually I think they are in order of market cap).

Shorts:-
(stock;entry;stop;target;£pp)
BLND; 563.2; 600; 482; £5pp
KAZ; 272.5; 300; 182; £7pp
VPC; 408.1; 450; 305; £4pp
BXTN; 145.3; 160; 109; £13pp
CRDA; 458.9; 500; 337; £4pp
SGRO; 278.8; 300; 197; £9pp

Longs:-
ADM; 955.2; 900; 1103; £3pp (weaker signal)

Good night everyone and good luck tomorrow.
Your comments/questions are greatly appreciated.
Adam
 
Hi Jon

Thanks for the chart and your comments.

I like your technique. Do you use any screeners to find good set-ups or do you prefer to manually check the charts?
Also how do you decide when to close a winning trade? With my system I am looking at a break-through of the opposite Bollinger band which can give quick profits but sometimes results in missing the majority of the price move.
Are you using the high of the pullback as your stop in these trades?

I hope you don't mind answering my questions and thanks for taking the time to look at my trading journal.
 
Midmorning update:-
Only Segro of today's pics were filled but then quickly closed when it hit it's stop. Actually there is a spike on etrade that goes all the way up to 319.9....so a fast loss on that one.

Open trades:-
JMAT; 992; £6.00
LGEN; 81.2; -£80.60
IHG; 551.3; £2.00
WPP; 373.9; -£47.50
BG; 932.5; -£72.20
AV; 405.2; -£4.00
PRU; 367.7; £16.80

Closed trades:-
ITV; -£198.80
SGRO; -£190.80

Total: -£569.10

Recovered a little from yesterday but the whipsaw on the SGRO trade added to the losses. I just had a quick look at the SGRO spike on the 1 minute chart and it looks like as least 2 trades were filled so I will keep the losing trade on the account here to keep the results as fair and accurate as possible.
 
Ok here's today's update. Only SGRO was opened (and closed) as a new trade today. The following are the remaining open trades (all shorts):-
JMAT; 1020.5; -£136.50
LGEN; 81.0; -£78.00
IHG; 563.3; -£46.00
WPP; 389.2; -£124.00
BG; 943.5; -£94.20
AV; 407.7; -£16.50
PRU; 389.2; -£47.70
Closed trades:-
ITV; -£198.80
SGRO; -£190.80
Total: -£932.50
Change on yesterday: -£252.30
 
Hi Jon

Thanks for the chart and your comments.

I like your technique. Do you use any screeners to find good set-ups or do you prefer to manually check the charts?
Also how do you decide when to close a winning trade? With my system I am looking at a break-through of the opposite Bollinger band which can give quick profits but sometimes results in missing the majority of the price move.
Are you using the high of the pullback as your stop in these trades?

I hope you don't mind answering my questions and thanks for taking the time to look at my trading journal.


bbb

1. I have a stable of around 25 + or - ftse100 shares by an eyeball judgement of those which seem suited to the approach. I spin through the whole 100 daily and quite happy for the stable to be actively flexible in comings and goings.

2. exits are not clear cut. In theory you should hold on until the previous swing high (low) goes, but this is often a long way away with the prospect of wiping out considerable gains. In practice, I tend to start scaling out on any second pullback bar on the basis that I will be re-entering if a third(+) one prints and a continuation triggers. In addition I will often go if the general market direction becomes vigorously against the direction of the share position I am holding; and then there's some specific intraday price action I don't like that causes me to run (sometimes needlessly, but often justified)

3. stops - yes, there or thereabouts and adjust position size to "equalise" risk. Sometimes use intraday levels though.

good trading

jon
 
Here are tomorrow's set-ups:-
(Stock; Entry; Stop; Target; £pp)
Shorts:
RIO; 1635; 1900; 1000(?); £1pp
KAZ; 262; 280; 213; £11pp
IPR; 237; 260; 212; £8pp
SGC; 146; 160; 111; £14pp
PFC; 332; 350; 288; £11pp
Longs:
CGL; 422; 400; 449; £9pp
 
Midmorning update:
BG and a new trade in CGL were stopped out this morning for -£161.20 and -£198.00 respectively.
The current open trades are as follows.
JMAT; 1025.5; -£161.50
LGEN; 78.2; -£41.60
IHG; 565.3; -£42.00
WPP; 380.2; -£79.00
AV; 394.2; £51.00
PRU; 368.7; £13.80

Closed trades: -£748.80
Open trades: -£259.30
Total: -£1,008.10

Maybe I should short my longs and long my shorts!
It's still very much work in progress. I think it would be wiser to wait for some sort of confirmation before trades are entered. I'll keep the journal going so people can see how it progresses. Feel free to add any comments or suggestions.
 
Top