Bear Market almost ready to resume ....... March 12, 2019 posted at ET

Status
Not open for further replies.
Possibility #1:


A giant Wave 4 is forming as an Expanding Triangle. This means that a Wave 5 up is yet to come, thus the bull market will continue north in a big, big way to ever higher highs because a Wave 4 is thepenultimate wave, meaning the ultimate is wave 5. Dig? See where "E" is marked? that wave E will complete Wave 4. this pattern then means we have a huge drop in the markets coming up now. It will not be the CRASH called for in this thread, so I will be dead wrong, but it will be a significant crash. But as you know, I wil lnot take any credit for just a mere piddly crash. I want the whole thing just as I called it from day 1. So if this turns out to be the case, I will accept 100% that my CALL is wrong. And try again.

264899
 
Possibility #2:


The scenario is as per this thread's TOP CALL. so, if this scenario plays out, then I will be 100% correct in thread Top call, although some points will be chopped off for not seeing the marginal higher tops. the reasoning here is that the 5th wave in progress is an expanding triangle 5th as shown


264902
 
Wave relationships in the Dow Jones coming up next .............. later
 
Nice! Small change reqd.


refer to your chart. See the July low? That should be marked as "start" or "0" ....... meaning that's where you start your wave count. So the first leg up from this ""0" would be "1" .................... then you continue as you have.

Redraw and post


Happy Saturday Fibo - busy day seeing family today.

I've gone from the july low here from the 1st July. Do you track these movements in 5 waves? 0-5. Is this what you tend to apply to most? As this is the trade with Fibo skin in game, interesting to see how this pans out. and even better we have 2 potential ways this could go.

Would you take the 4th to 5th wave here as I have done, or would you take it to that Doji with a huge wick? the one that falls 11th July to 12th July? as it isnt a higher low.and shows the bears drove that mother effer down. Lots of little dojis forming around the current 4 hour candle, a few with some nice tails - but even looking back through previous price action, these long tails don't alway result in a drive down. Looking at upper bollinger band, still some room to the upside - surely head needs to come out market.

What goes up, must come down.


264903
 
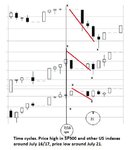
Down move in US stock indexes week of July 14.

If you trade stock index here is my analysis.
 

Attachments

  • forum.jpg
    forum.jpg
    28.6 KB · Views: 86
Happy Saturday Fibo - busy day seeing family today.

I've gone from the july low here from the 1st July. Do you track these movements in 5 waves? 0-5. Is this what you tend to apply to most? As this is the trade with Fibo skin in game, interesting to see how this pans out. and even better we have 2 potential ways this could go.

Would you take the 4th to 5th wave here as I have done, or would you take it to that Doji with a huge wick? the one that falls 11th July to 12th July? as it isnt a higher low.and shows the bears drove that mother effer down. Lots of little dojis forming around the current 4 hour candle, a few with some nice tails - but even looking back through previous price action, these long tails don't alway result in a drive down. Looking at upper bollinger band, still some room to the upside - surely head needs to come out market.

What goes up, must come down.


View attachment 264903


Ausgezeichnet Sontag, Herr Sam,

"0" should be place on an intermediate wave low, not minor wave low. Like "2" for example

"3" and "4" are incorrect as the wave structure is telling you that a subdivision is occurring. this is a bit advanced so I will explain just as soon as you tell me the instrument
 
See Dow Jones trendline shown earlier ...................... now we look at the others like SPY, SPX, COMP

264912
 
Nasdaq Comp: Nazzy has arrived at the trendline but its doing something cool - its throwing over = exceeding the line. To be expected when bullishness is super high


264913
 
El magnifico Dow Jones Transportation Index, the cat who calls the Economy very closely is nowhere near the all time top. In fact it is resembling the diamond mentioned posts ago.


264914
 
And where is the Champion? The New York Stock Exchange composite Index? He has not made a new high and is bumping up at resistance (blue)


264915
 
S&P500: note the 2 red trendlines. One has been hit, the other not yet, but its close


264916
 
The consensus message therefore is that the 3 major Indexes have arrived at the top line of the Expanding Triangle. Is any Heavy stuff gong to go down? do birds fly? :) :) :)

Fasten seatbelts, hide and watch.

Have they fired 6 shots or only 5?

Is it safe or is Fibo going to need a bigger boat?
 
Fibo's SPY trades brought over from the other thread, "Hope dies ..... "


SPY short if/when < 297.53, STOP = 300.2
SPY shortif/when < 296.29, STOP = 300.2
SPY short if/when < 295.17

no TP but eye on 200-pd on 1H for re-assessment. Might close half if it looks bouncy and then hammer the rally top on 1H.
If however it goes right thru' 1H, I might just bugger off on holiday and let it rip to Argentina.

That's the plan. 2 down trades thus far. Will these turn it around for Fibo?
 
Returning to El Kapitan, the mighty Dow Jones - he has only 30 components but BEAR has eyes only for him and zero eye for the S&P500. This magnificent chap (Dow Jones) when spliced with British stock prices from the way way way back gives some outstanding history for Fibo. some of the data is sketchy so its a work in progress.

As mentioned in earlier posts there are 2 possibilities, here is one of them again


264917
 
Dow Jones Fib projection grids

You've already seen the perfect hits of 161.8% shown earlier. So here for continuity, one is shown at the December low and now for the current entire rally upfrom December lows is the 161.8% target for Jones as shown. It has not yet been hit. Will it get hit or will Jonesy fall short of it?

I'm still looking for other fib relationships within the wave itself, but thus far Jonesy not cooperating


264918
 
Just comparing the markets you have posted above ; (BLUE LINE SPY TRACKING ON NYSE COMP CANDLES)

First observation, the first touch of the resistance have both occurred around the same time (May19)

Second observation - NASDAQ looks like it leads SPY ever so marginally.
264919
 
London FTSE monthly wave counting for the Duke of London, Sam :)

Good habit to develop is your numbering system. The Primary waves are larger than secondary waves so are circled as shown. the intermediate waves are shown as (1) etc., Minor waves are shown as 1, 2, 3 etc.


264920
 
Status
Not open for further replies.
Top