Baffled by Backtesting

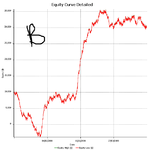
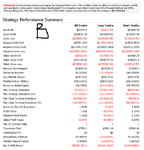
And B - Equity Curve and details.

Note B loses more than enough money to begin with, which leads me to believe that the Gap grades were a large component of the PnL.

Both examples are with same commissions and slippage, no compounding.

Now clearly what works for A doesn't work for B, but:

*Included in the backtest are somewhat arbitrary variables (that is, I chose them from experience having traded these "manually" and haven't changed them). If I change these variables for B, how do I avoid curve fitting them?

*A and B are different asset classes, there is no reason to expect what works on one will work on another

*changing the slippage to something more likely improves the performance dramatically


Thoughts?
 

Attachments

  • B_Equity.PNG
    B_Equity.PNG
    26.4 KB · Views: 204
  • B_detail.PNG
    B_detail.PNG
    31.3 KB · Views: 196
Optimisation without over-optimisation is relatively straight forward.

Take a look at your optimisation results. As you vary one parameter, do you see that the returns for the system rise and rise and peak at the crest of the curve and then decrease similarly after that? That would be a classic situation where you know you should just choose the parameter value in the middle that is at the top of the curve.

If the graph is spikey like the spikes on a seismograph, then you can hardly choose a good one and expect it to carry on being good in the future. One small move in one direction or the other representing a change in market conditions would scupper your system.

Also after optimising, walk it forward again just to check the results hold up.

I don't think there is an optimisation option on eSignal, so i would be left to changing them "manually" and comparing results. I guess the task is to pick out the "problem period", find what works there, and apply that to the whole series to see what happens?

On the other hand, because I'm trying the strategy on different asset classes, I am somewhat inclined to just ditch it on contract B; not all instruments behave the same way, for instance the demographics of participants in that particluar market are unlike the demographics in another - I mean, STIR contracts generally trend pretty well but are subject to very large moves occaisionally... Equity markets tend to sell off more aggressively that they rise etc... will a positive strategy work on all instruments?

I am confused about the balance between optimisation and curve fitting... sure, I could change the parameters of the strategy for B until the backtest shows an equity curve similar to A (there are, I think, sensible grounds for doing this bearing in mind the changes since March 2007), or I could just decide to use the same strategy as is but only on contracts with positive backtest results.

Both of these seem like retrospective adjustemts to me, what do you guys think?

FYI, I managed to do a bit of jiggery pokery with the PnL for instrument A today... I:

* Included compounding, making the percentage equity swings uniform to a degree
* Bootstrapped the individual trade results

and the results didn't change much. Will do it on B also but had other things to do. When I get the chance I will do some more analysis of the Equity curve including compounding/bootstrapping (Max Drawdown, probably some descriptive statistics etc).

Actually, it would be great of anybody that does trade a mechanical strategy (profitably!) could give me some orders of magnitude for some standard metrics (confidence levels, profit factor and such).
 
This has become a very interesting thread. It's nice to see you are putting some serious effort into this.

Peter
 
I think finding what works on the problem period might not bear fruit. First off, there might be no way of making it profitable on that period, and secondly if there is, it might be diametrically opposed to the config you need the rest of the time. It's probably worth looking into though just to get a feel of what works and what doesn't, and to put it down to experience if you get nowhere.

There's a spectrum of opinion on optimisation ranging from the purist "don't do it" at one end to the scamsters at the other who over do it to sell their systems. Somewhere near the purist end of the scale there are all the LTTF people, the disciples of Ed Seykota who will sneer at your system if it doesn't work unaltered across all markets. Then you've got Pardo who's quite a respected author whose books talk a lot about optimisation and testing.

For me the main test of whether it's OK to optimise a parameter is to look at the curve of returns against parameter values. If it's a nice curve with one obvious peak, then it would be dumb not to use that value, and it's a good sign that the results will be reproducible in the future. A spikey graph I reckon means you've either got a parameter on an algorithm that is too complicated, or you haven't got a big enough history in the backtest.

I agree with you that ditching a market is a valid response, although it's better if you've investigated exactly why the system doesn't work on that market, at least superficially. It's all part of the process of comprehending your system, why it works, why it sometimes doesn't work, and to build up your knowledge of it that you need when you're trading it live and have incoming wounded. I hope I don't sound like I think I know it all - I freely admit I don't so this was an opportunity to go over it all again.

By the way what do you mean by 'bootstrapping'?

And confidence levels? You'd have to get a statistician for that. Never quite figured out what they were all about even when I knew how to work with them. The profit factor I'm working with is anything from 1.1x to 2. Anything that I ever found with a PF more than 2 traded so infrequently I found it difficult to trust. I like dollars/trade as a stat, and for hourly bars I'd like a system to give $60 before transaction costs, for a trend following system. Obviously drawdown is a major statistic but depends totally on the test period length - I always wanted to measure drawdown on a per trade basis, but it only compares well if you're looking at a big sample size.

Actually instead of waffling on about each stat, I guess most traders develop a taste for their own choice of combination, I guess mine is all together: PF, dollars per trade, number of trades, %profitable, DD, avg +, avg -ve trade.

I'm just doing some optimisation now, if the results show what I mean well, I'll post them.
 
I have managed to get the PnL per trade into Excel which means there is alot more I can do with it... I will post what I have done when I have done it all!

Bootstrapping is taking each trade and re-ordering it. For example, if the strategy only works because it started off with 50 straight winners, bootstrapping the data will show that up.

I have also taken out the top 100 winning trades and worst 100 losing trades... there are a variety of things I want to do on the data that I will explain in due course.

Confidence levels aren't tricky to find out btw.
 
Confidence levels aren't tricky to find out btw.

No? For me, they're like those Magic Eye pictures that you can't see unless you have the knack.

Another thing that foxes me is representativeness. Say you are doing a backtest optimisation. You have what you think must be a good parameter value and so you walk it forward on unseen data. But how much data or how many trades are representative?

It's obvious you need more than 1 trade in your walk-forward. But how many to make it credible? It'd be a shame to chuck out a system because it failed a walk-forward if the number of trades in the results just wasn't enough to be representative.

I know there's a way of working out what is representative but the only explanations I've seen e.g. at wikipedia are couched in statistical jargon that puts me in a deep sleep.
 
Dude, isn't it just p-values that you need?

the p-value where the null hypothesis is that the mean of your trades is > 0

the p-value that the trades you have walked forward are from the same population as the backtested data?
 
You must be a statistician! p-value could well be what I'm after, but I would never know.
 
Right, what I have done is bootstrapped the whole series of 4,500 ish trades and set up a cell to calculate the maximum drawdown. I then set up a macro to basically re-bootstrap the data, take the maximum drawdown and add it to a range, re-bootstrap etc.. 1,000 times. So I have 1000 instances of Max Drawdown -

*Maximum Maximum Drawdown = 54%
*Average Maximum Drawdown = 32%
*Standard Deviation of Max. DD = 8.49

(example; say I am tossing a coin, and I get H H H T T T... bootstrapping is would involve re-ordering the 3 heads and 3 tails randomly).
 
Over the 1000 simulations, there were 13 instances where the maximum drawdown was more than 50%. If I say my Maximum permittable Drawdown is, say, 40%, then I reckon the probability of that is just

=NORMSDIST((40-32)/8.5)
=0.8262

so there is an 82% chance that my drawdown will be no more than 40%. The 95% interval comes in at a Drawdown of 46%

Now, I could do with some guidance here; as I understand it, the issue can be ascribed as one of three varieties:

* The strategy is not tradeable in real time
* There is a flaw in the backtest code
* The results were lucky

What is it that I am missing?
 
... * The results were lucky ...

Hard to believe this would be the case. IMO, you've put in enough effort and testing (bootstrapping, etc) to dispel the "lucky" critics. Nothing necessarily is wrong with the backtesting either. Could you stomach the 40-50% drawdown in real time? And is this drawdown risk proportionate? That issue is as big or bigger than the 3 issues you are looking at.


Looks good so far.

Peter
 
Yes, the Max. Max Drawdown is too high for me.

Using the individual trade results, I get a t-test statistic of 11.4 - so I can be pretty sure that the strategy has a positive expectancy. This Drawdown stuff is for finding out how the same strategy would have performed in a trade order...

... the next stage has to be to forward test it and compare the two results to see if they could be from the same sample - the liklihood that the most recent results are from a different sample from the backtested results. Of course this is no guaruntee that it will continue to be the case, but it should highlight any over-optimisation issues that have crept in (I think, anyway).

Finding out whether the strategy is tradeable in real time involves changing / adding data services, which I am not too keen on to be honest (Continuity etc) so I am trying to find out what the problem is before that.

As I mentioned earlier, I would be grateful if someone who trades mechanical rule-based systems could add their suggestions and share eperiences, I really am just following my nose here.
 
OK, I have discovered a (rather silly) mistake in the drawdown calculation. In the s'sheet, I had included a limit on the number of contracts to deal in (simply balance / margin)... as we got to the back end of the series, this limit had the effect of reducing the %age changes in the PnL to almost flatline - which in turn artificially reduced the Max and Average DD stats... I removed the upper limit and re-ran the bootstrap method.

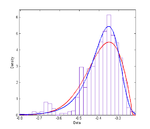
This is starting to look a little more like what I would expect to see - MaxDD in the region of 80%, and depending where it appeared that could well make the strategy untradeable because of discrete deal sizes in futures markets.

Matlab said:
Distribution: Extreme value
Log likelihood: 1097.03
Domain: -Inf < y < Inf
Mean: -0.389868
Variance: 0.00750437

Parameter Estimate Std. Err.
mu -0.350881 0.00224255
sigma 0.0675434 0.00169953

Estimated covariance of parameter estimates:
mu sigma
mu 5.02901e-006 -1.16129e-006
sigma -1.16129e-006 2.88839e-006

One thing I notice is the "mini peak" towards the 70% region... don't know what it means but its definately there. The purpose behind this is to answer the question "what is the liklihood of having a MaxDD as bad as XX%?"
 

Attachments

  • MaxDD_Dist.PNG
    MaxDD_Dist.PNG
    8.5 KB · Views: 214
Should I bootstrap over a smaller period? I'll explain my reasoning...

... Presently, I am taking 3yrs worth of trades, re-ordering them, and taking note of the maximum drawdown each time. I'm doing this 1,000 times compounding all the way.

Is this the same as generating a synthetic PnL that extends out over 3,000 Years and finding what the Maximum Drawdown would be over any 3 years?* If the probability of getting a MaxDD of > 50% from a sample size of 1,000 is, say, 70/1000... then is the probability that I get a MaxDD greater than 50% over the next 3 years as simple as 7%

Because of course there is the Gamblers Ruin... I mean, at some point every strategy will run into the ground, but is that more or less likely than me living to be 3,000 years old or the strategy working for that long??!!

Answers on a postcard - somebody must have done something similar to this???? I am confusing myself!!

* with the cavceat that all market conditions in the next 3,000 years have been included in our 3yr sample
 
Mr Gecko,

I'm not quite clear - do you include compounding in your trade results that you bootstrap? If so what sort? Straight fixed fraction or a strategic money management algorithm built into the system?
 
without knowing more about which instrument your trading, the backtesting/walk forward method etc and the specifics of the strat its impossible to offer any worthwhile help.

what i can say though is that its very easy to make a sexy looking equity curve in a backtest, only for it to fall over in live trading. For me, the main reasons when this has happened has been due to unrealistic slippage or unrealistic execution assumptions. the avg trade is $17 ($116028/6801 right?), so that doesn't leave a lot of room for any errors with these. if your using stop/limit orders then the fill assumptions may be a problem., ie the price hits the limit/stop price and the backtesting software assumes a fill, whereas in real life the you wont get filled.

the best thing you could do would be to live test for a few months, but that's probably not what u want to hear :)

ps welcome to the dark side lol
 
re bootstrapping, r u using the backtested or out of sample trades?
 
I use a fixed fractional strategy... the number of lots to trade is a function of the stop vs. Account balance. I do this so that the losses at the end of the strategy are of similar %age magnitude to those at the front. when I had the # lots capped, losses at the end of the strategy were for less of teh account balance that the beginning.

This happens on each bootstraped Equity curve.
 
re bootstrapping, r u using the backtested or out of sample trades?

The original backtest was on 6months, then out-of-sample test was on 3yrs which is the data I am using for the bootstrapping.
 
Top