Baffled by Backtesting

MrGecko

Senior member
Messages
2,778
Likes
789
I have been playing around with mechanical strategies, and have found one that I am happy with. I have backtested it but the results look a bit "too good to be true"*. I have done the following to make sure I'm not making stupid mistakes:

* Tested it on out of sample data (strategy designed on 6m sample, tested on 3yrs)
* Significant sample size
- Instrument 1: 6,801 trades from 13th March 2007
- Instrument 2: 5,121 trades from 13th March 2007
* Been through the backtesting logic to make sure I'm not buying at unavailable prices
* Included commissions and slippage (aggressively)
* picked out trades from the sample and "sanity checked" them
* I am not holding overnight positions
* forward tested the methodoligy

Can any of you guys with more experience give me some guidance as to other things I should check?

Thanks

G

* Without compounding:
Instrument 1 - $10,000 -> $126,028
Instrument 2 - $10,000 -> $154,475
 
Definitely looks too good to be true but here's a few things that might help.

Are you using metatrader? IF so, then do many of your trades close within the same bar that they were opened? In other words if you are using a 1H time frame and many trades open and close within the same bar/candle, this can cause skewed results.

Other things you can try:
- testing on data from 2001-2005 long term trends change over time.
- apply all the same tests with a different broker and see if you get similar results
- forward test on a live account (micro account so you won't risk much) for 6 months.

You don't mention what your drawdown is. The results look good, but suppose it takes a 70% drawdown to get there can you tolerate that?


Peter
 
Are instrument 1 and 2 highly correlated? If so, how does it work on something non-correlated.

Obviously check that there is no 'look-ahead' in the strategy. And are the results of the out of sample data pretty similar/worse/much worse?
 
Last edited:
Definitely looks too good to be true but here's a few things that might help.

Are you using metatrader? IF so, then do many of your trades close within the same bar that they were opened? In other words if you are using a 1H time frame and many trades open and close within the same bar/candle, this can cause skewed results.

Other things you can try:
- testing on data from 2001-2005 long term trends change over time.
- apply all the same tests with a different broker and see if you get similar results
- forward test on a live account (micro account so you won't risk much) for 6 months.

You don't mention what your drawdown is. The results look good, but suppose it takes a 70% drawdown to get there can you tolerate that?


Peter

Not using Metatrader (eSignal) but have checked for the "same bar" scenario and it isn't there. Also checked that, for example, limit orders aren't being filled when price doesn't trade there; uses market orders on the open of the next bar anyway.

As for the longer - term data suggestion, the strategy is making intra-day trades, an average of about 6 a day. And I think I've got all the data I can get.

Max drawdown 24%
 
Sounds good :) . And I assume there was no real optimizing/lots of variables with arbitrary numbers. The period you've tested on as very high ATR, and (depending on what instruments you look at) we certainly got some great trends> Just do a check that it isn't suffering in low ATR or consolidation times. Good luck with it!
 
Are instrument 1 and 2 highly correlated? If so, how does it work on something non-correlated.

Obviously check that there is no 'look-ahead' in the strategy. And are the results of the out of sample data pretty similar/worse/much worse?

tried it on another asset and results are choppier but still positive - however, I wouldn't trade it on this instrument because it behaves differently.

Yes, "look ahead" issue is one I've thought about but I can't see how it could have worked it's way into the program (it's an n-bar breakout approach). How would you check for this?
 
Sounds good :) . And I assume there was no real optimizing/lots of variables with arbitrary numbers. The period you've tested on as very high ATR, and (depending on what instruments you look at) we certainly got some great trends> Just do a check that it isn't suffering in low ATR or consolidation times. Good luck with it!

The strategy is designed to stay flat during consolidation... by using such small timeframe data I am assuming that I've encountered all types of market conditions (I mean, on a 5m basis, will the last 3yrs of data be that different to the 3 yrs before that?? Markets are fractal in nature and all)

As for optimization / no. of variables, there are 3 degrees of freedom and they are all pretty much exactly the same as when I started.

I don't believe for a second that any strategy will yield these results, but I can't figure out where I've gone wrong.

P>S> Shakone, it was your comments in the "random entry" thread that got me thinking about mechanical / trend following strategies in the first place. Up to then I was absolutely convinced that they were ********.
 
Would like to see the results or the equity curve to make a more accurate assessment. Sneaky coders can do sneaky things to make you think that it's a good system. They want the internet fame.

One of my favorite ploys was called the scalpel.mql4. It won a high percentage and if you looked at the results it always had a stop loss open and very tight to the current price so you felt like it was just an accurate scalping EA with amazing results. What they tried to hide was that they modified the order everytime price approached their stop loss and moved it away by a few more points. Thus giving the appearance of a tight stop loss 'perfectly placed'.

I can get an equity curve fairly smooth in my EA's but if it looks too smooth good it's because they are waiting for the big loss and taking small profit.

GOLDEN RULES 4 ME:
Largest winning trade >= Largest losing trade (or at close to equal)
Drawdown in the area of 20-40% Max
Tested over 1000 bars
INCLUDES A HARD STOP and TARGET that won't break the bank
(in case I have an outage of internet or PC turns off.)

If you can achieve that, I'd say you've got a good 'bot
 
Would like to see the results or the equity curve to make a more accurate assessment. Sneaky coders can do sneaky things to make you think that it's a good system. They want the internet fame....

...I can get an equity curve fairly smooth in my EA's but if it looks too smooth good it's because they are waiting for the big loss and taking small profit.

GOLDEN RULES 4 ME:
Largest winning trade >= Largest losing trade (or at close to equal)
Drawdown in the area of 20-40% Max
Tested over 1000 bars
INCLUDES A HARD STOP and TARGET that won't break the bank
(in case I have an outage of internet or PC turns off.)

If you can achieve that, I'd say you've got a good 'bot

Well with the intra-day stuff I have found a problem with the way overnight gaps are treated, meaning trades are included that would be imposible to trade. Once I've figured out how to take them out, I'll post the results (although I do not think this is the sole cause of my problem)

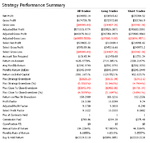
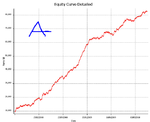
On the other hand, I backtested the same strategy on Gold using Daily data where Gaps shouldn't be so much of a problem. No leverage or compounding, commissions and slippage from 1991. The Equity Curve and strategy details are attached.

I don't want anyone to get the wrong idea here - I am certain that these results are not deliverable, I just don't know where I have gone wrong in producing them.
 

Attachments

  • Equity Curve Gold.PNG
    Equity Curve Gold.PNG
    36.8 KB · Views: 264
  • Strategy Summary.PNG
    Strategy Summary.PNG
    25.9 KB · Views: 251
Hi Mr Gecko,

I thought I'd seen every Holy Grail possible in my backtesting until now. All the usual reasons have been given and you're still producing the Holy Grail. I'd say now you have to run it in real time. That will reveal any skeletons in closets. If you've got the right broker, like IB, you can run it on the simulated trading account and the only thing that'll be different is the slippage.

But really it does look too good. WIth that kind of return, you'll own all the money in the world after 10 years.

There's one mistake it could be, a variation on one already mentioned, but if you enter at the open, and then you have a tight target and stop loss bracketed around it on the same bar where the distance between the target and the stop is less than the ATR, then your software e.g. NinjaTrader, will give you the closest exit and if that is always your target, then you've got a profit on most trades that doesn't happen in real life.
 
Last edited:
You're right about one thing mate - it does look too good to be true. Given that, I am basically going to keep pressing on finding out what the problem is until I am close to death from exhaustion.

If it still looks like that, then I'll give it a pop.

re: same bar entry/exit... the strategy goes long at the open of the bar after a signal has been generated and uses a trailing stop at the low of the prior n bars, so I don't think this can be the case.

Thanks for the input guys. One of the things I am looking at is testing the strategy on different platforms to see if there is anything happening that I can't figure out from my (very basic) understanding of the code in eSignal.
 
The only other thing that comes to mind is the slippage and commission. You said you were using aggressive levels - does that mean aggressively conservative or aggressive as in HFR-style low rates?

Aggressively conservative slippage and commission AND those level of results definitely mean you've got something wrong. But I'm v curious what you've done.

So you've only got a trailing stop? No targets? That rules out the issue I was talking about.
 
Can any of you guys with more experience give me some guidance as to other things I should check?

The key thing here is profit factor and you have a very high one. Why not try trading it with limited risk and see how it goes. That way you will know how good it is in a true environment.

Well done though :)


Paul
 
The only other thing that comes to mind is the slippage and commission. You said you were using aggressive levels - does that mean aggressively conservative or aggressive as in HFR-style low rates?

For commission I have used the maximum rate my broker charges now, not incuding any reduction for greater no. of round turns.

For slippage, I have said that each trade is split equally over two levels - the trigger level and the next one up/down as appropriate. My experience in trading these futures tells me that this is very unlikely given the clip sizes I would start trading it at. Moreover, the strategy uses Stop market orders for both entry and exit - that is, you know at which price you will get in at /out at before the order is generated.

The triggers are not at daily high's / lows where you would expect orders to be clustered and slippage to me more of an issue.

The issues I'm looking at now are;

1) the compounding - a 5% drawdown on a $300,000 account using one lot will halve a $300,000 account using 10 lots.

2) That I haven't done the initial checks as well as I think. This is already borne out by the Gap issue.

Using different software is obviously something I will look into, but it is not so simple to just chop and change, there are other factors to consider and I need an element of continuity for other things.

I have also tried it on a variety of other assets on a daily basis (FTSE, SPX, AUD, EUR) and the results are of the same standard - unbelievable, and I don't mean that as a superlative.
 
FYI, the strategy is one I have adapted from an idea another T2W member (long time lurker) gave me and he's asked me not to share.

I would love to have someone who knew what they were doing look over it, but I have to respect his wishes.

Again, neither of us think we will own all the money in the world, but we can't figure out why not. DAMMIT!
 
Hopefully you've found the holy grail :cool:
Start a thread and do some live trade calls with a small account for my own personal satisfaction.

Sorry I cant help in regards to your queries.
I know a lot less than you when it comes to that.
When i think I am on to something, I have to resort to going through various charts from different periods all by hand and marking where the method would enter etc.
Painfully slow, but my only choice given that I dont know anything about coding/programming etc.

Good luck
 
I have been playing around with mechanical strategies, and have found one that I am happy with. I have backtested it but the results look a bit "too good to be true"*. I have done the following to make sure I'm not making stupid mistakes:

* Tested it on out of sample data (strategy designed on 6m sample, tested on 3yrs)
* Significant sample size
- Instrument 1: 6,801 trades from 13th March 2007
- Instrument 2: 5,121 trades from 13th March 2007
* Been through the backtesting logic to make sure I'm not buying at unavailable prices
* Included commissions and slippage (aggressively)
* picked out trades from the sample and "sanity checked" them
* I am not holding overnight positions
* forward tested the methodoligy

Can any of you guys with more experience give me some guidance as to other things I should check?

Thanks

G

* Without compounding:
Instrument 1 - $10,000 -> $126,028
Instrument 2 - $10,000 -> $154,475
Make sure your system is not over reliant on trending or ranging strategies.
For example, any system on EU recently might have made a lot due to the strong trend but it doesn;t mean the system is foolproof, only that it lucked out.
 
Make sure your system is not over reliant on trending or ranging strategies.
For example, any system on EU recently might have made a lot due to the strong trend but it doesn;t mean the system is foolproof, only that it lucked out.

Well the original test was done using 5m data over 3 and a bit years; I have assumed that on a 5m basis, we have seen all sorts of market conditions over that time.

Whether it is right to assume that or not I can't say. The strategy still overperforms on daily data from the 70s in some cases though.
 
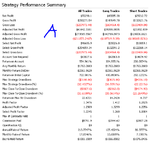
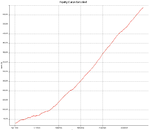
Ok, update on the Gap - problem, I think I have managed a work-around.

Details for original contracts to follow, A first
 

Attachments

  • A_Equity.PNG
    A_Equity.PNG
    22.3 KB · Views: 214
  • A_Detail.PNG
    A_Detail.PNG
    26 KB · Views: 221
Top