W/e review
W/e review
Price travelled 123% of it's 20 week atr this week just closed and 136% of it's 20 day atr on Friday also now closed. So far this month price has travelled 45% of it's 20 month atr.
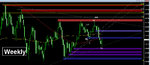
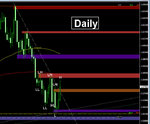
re charts: yellow = 100sma, red = 200sma
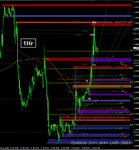
No fractal swing created by the close of this week's Weekly candle - a bullish candle whose lower wick is longer than it's upper. The week at it's 5630 low probably saw a boumce of the weekly/monthly descending trianle that is the bottom of the monthly wedge pattern or that is certainly how it appears when this t/line is viewed on a weekly or monthly chart. On the daily - actually joing the releveant swing lows it seemed to be slightly lower but whatever. The t/f remains in an opa range and this 5630 low comes ata LL although as stated that is not a fractal swing on this weekly t/f
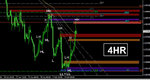
Friday's Daily candle saw an upside breech of the daily descending trendline and a bullish close and follow thru on the previous 2 x bullish candles that created the 5630 swing low as a L on this t/f. No fractal swing created by Friday's daily candle close but when it comes it will come at a H at least above the last LH of the opa downtrend. This t/f is still in a general opa downtrend but this is under threat now by the HL and H. A new ascending daily trend line can be established by the fractal swing low on this t/f at 5630.
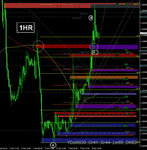
The 4Hr t/f saw a double bottom at that 5630 low and it's been uphill all the way since with an upside breech and close of 2 x descending trend lines and the daily descending trend line mentioned above, now printing a HH above the last H resulting in a possible new opa uptrend but more likely ranging - bullish conditions now on this t/f.
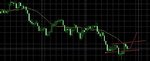
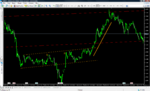
The 1Hr sees definate signs of strength now in a general opa uptrend with the last HH and high of the day/week at the previous 1hr swing hi zone /38.2% 6179-5630. At the close price had pulled back off it's 5844 hi and was finding some demand at the 23.6% fib of the 5630-5844 move
G/L